
Hands-On Tutorial for Measuring Activity and Output Metrics in the Girls Code Program
Welcome to the hands-on tutorial for measuring activity and output metrics in the Girls Code program! This tutorial will guide you through a step-by-step process to effectively measure and analyze the program's success. Let's get started!
Step 1: Understanding the Problem Statement Before diving into the metrics, let's take a moment to understand the problem statement. Our goal is to assess the success of the Girls Code program and improve its outcomes using data-driven decisions. To achieve this, we will measure both activity and output metrics.
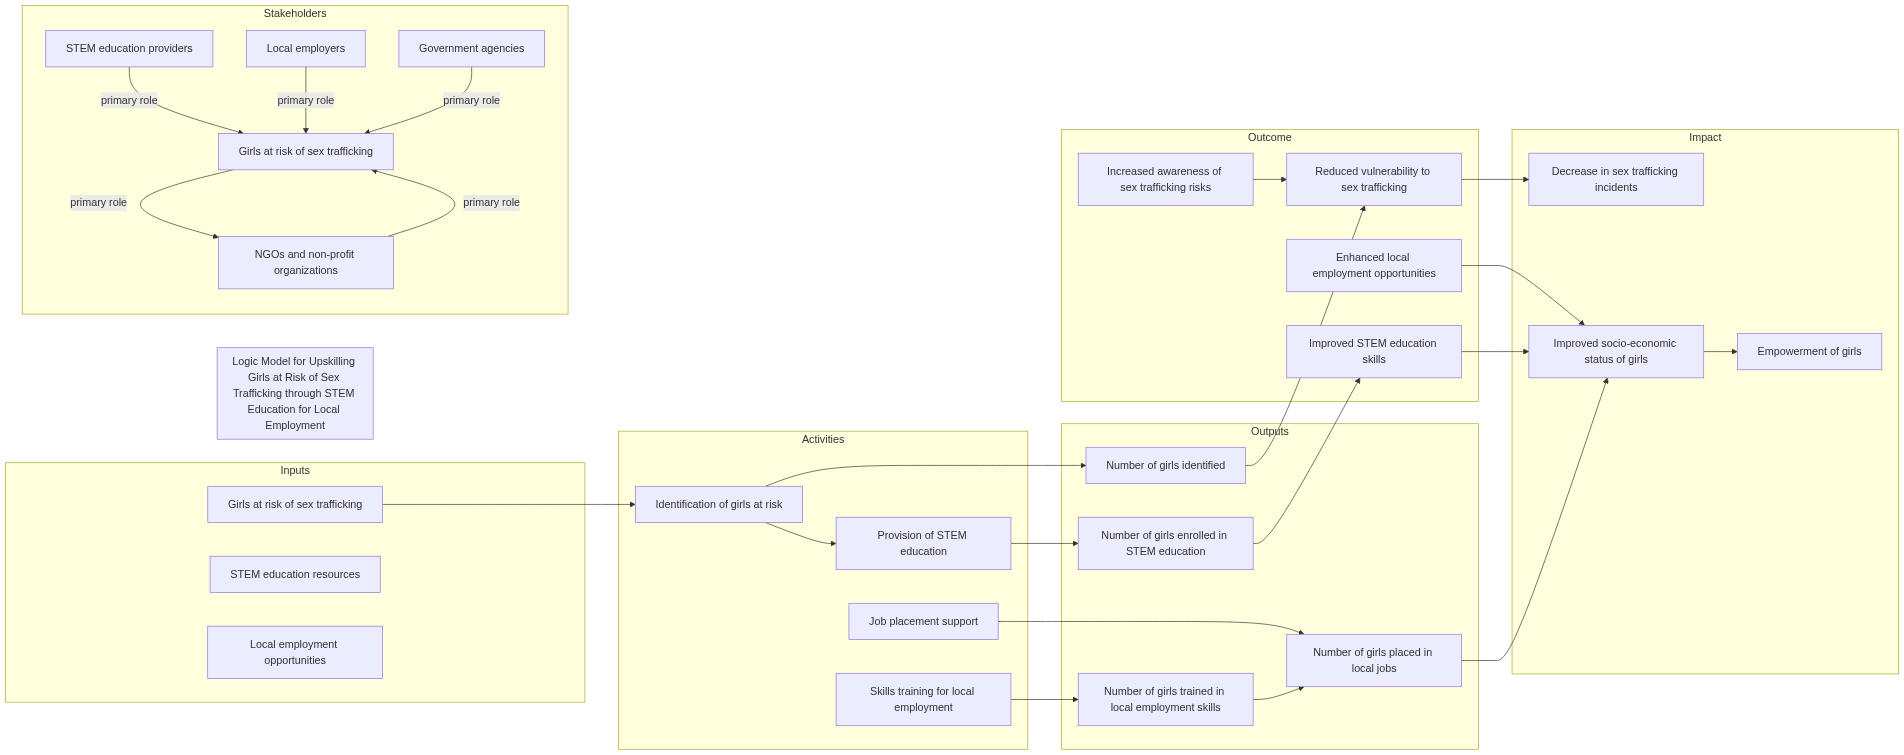
- Logic Model: Girls at risk of sex trafficking can be upskilled through STEM education, preparing them for skills necessary for local employment.
- Problem Statement: Girls at risk of sex trafficking lack the skills necessary to find employment and are vulnerable to being trafficked.
- SDG Indicator ID: 5.5.1
- Key stakeholders: At-risk girls, STEM educators, local employers
- Key impact themes: Gender equality, Education, Decent work, and economic growth
Study the logic model below carefully. Since it is compressed, please zoom out to review.
Step 2: Defining Activity Metrics Activity metrics measure the progress of the Girls Code program's activities. Here are a few examples:
a) The number of girls who have completed the program
b) The number of hours girls have spent coding
c) The number of teachers trained
Step 3: Collecting Data for Activity Metrics To measure activity metrics, we need data.
Follow these steps:
a) Choose data sources such as paper forms, Excel spreadsheets, Google Sheets, or other databases.
b) Collect data for each activity metric defined in Step 2.
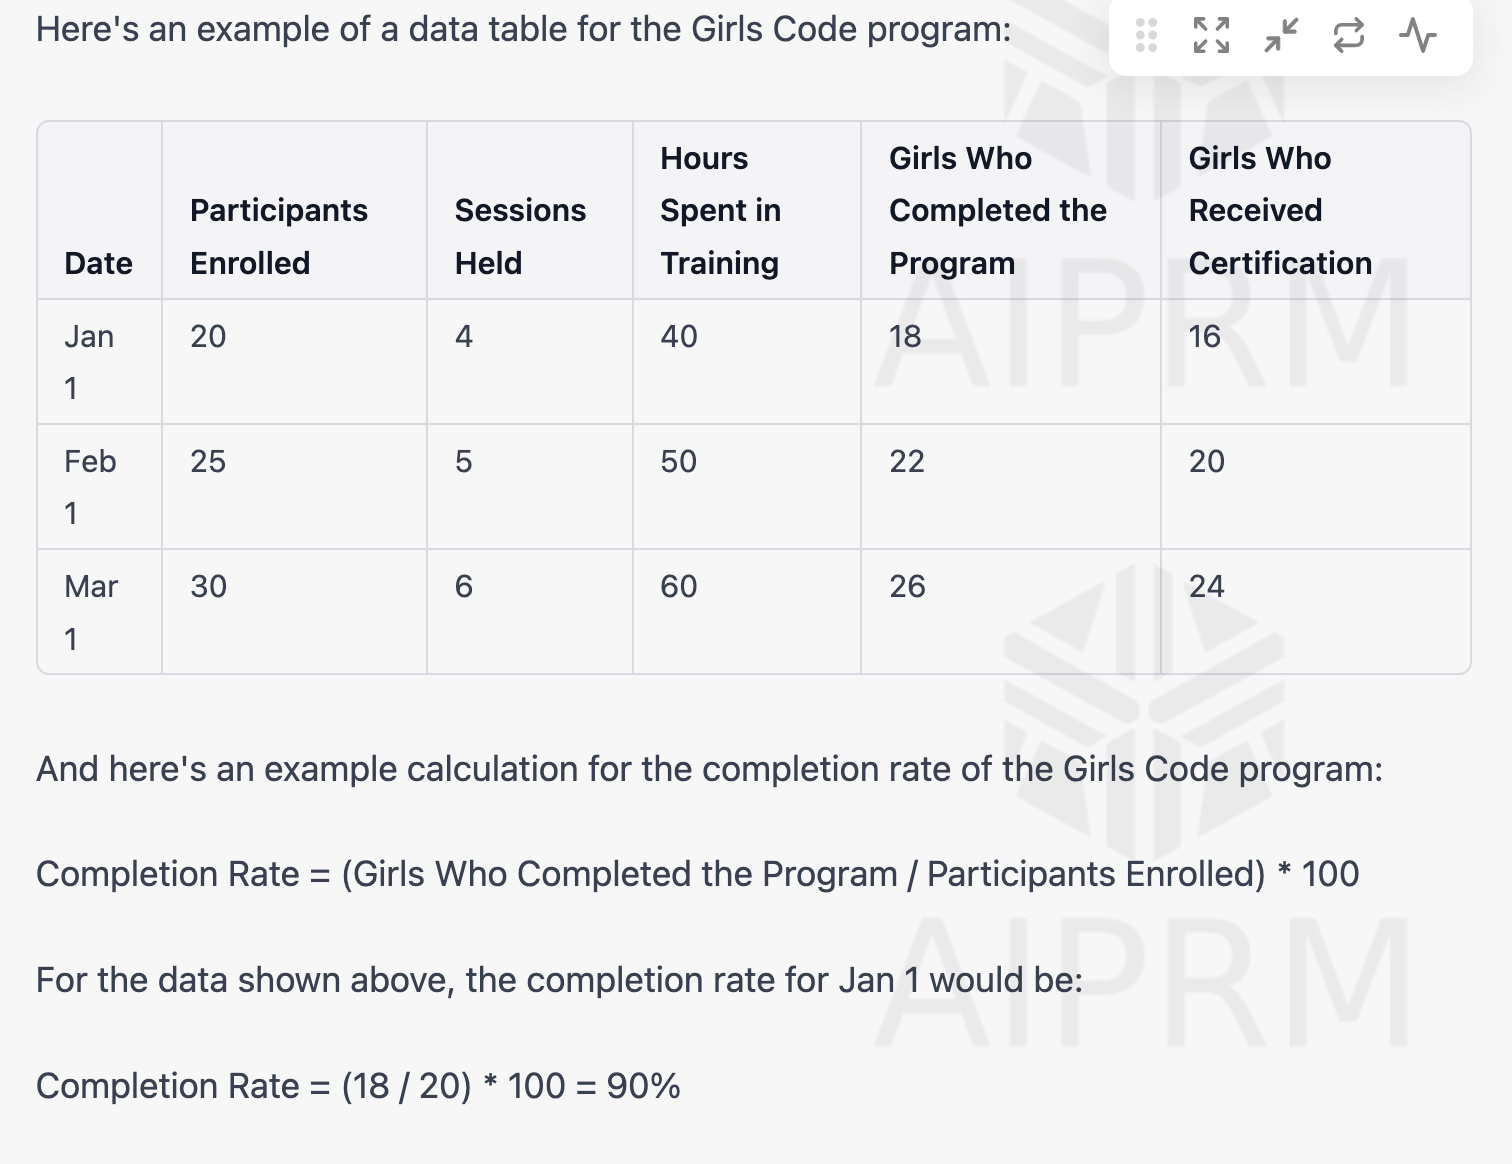
Step 4: Creating a Data Table for Activity Metrics
Now that we have the data let's organize it: a) Create a data table with columns for each metric (e.g., program completion, hours spent coding). b) Add rows for each participant or group of participants.
Step 5: Calculating Activity Metrics
With the data table in place, we can calculate key activity metrics: a) Calculate the average number of coding hours per participant. b) Calculate the completion rate using the formula: (Girls Who Completed / Participants Enrolled) * 100.
Now click this link to build your activity, activity metrics, and data point.
Step 6: Defining Output Metrics Output metrics measure the impact of the Girls Code program. Here are a few examples:
a) The number of girls who have found jobs in the tech industry
b) The number of girls who have pursued higher education
Step 7: Collecting Data for Output Metrics Let's calculate output metrics using the same methods as activity metrics: a) Choose data sources and collect data for each output metric defined in Step 6.
Step 8: Creating a Data Table for Output Metrics
Next, we need to organize the data for output metrics: a) Create a data table with columns for each output metric. b) Add rows for each participant or group of participants.
Step 9: Calculating Output Metrics
Finally, we can calculate key output metrics:
a) Calculate the percentage of girls who have found jobs in the tech industry.
b) Calculate the average salary of those who have found jobs.
Now click this link to build your output, output metrics, and data point.
Step 10: Outcome
The process remains the same, so follow the below page
Now click this link to build your outcome, outcome metrics, data point, and survey
Conclusion:
Congratulations! You've successfully learned how to measure activity and output metrics for the Girls Code program. By carefully collecting, organizing, and analyzing data, you can make informed decisions to enhance the program's effectiveness and achieve your goals. Thank you for participating in this hands-on tutorial, and we wish you success in improving the Girls Code program!