
In this article, you will learn to create a Histogram
Introduction:
In other words, a histogram is a diagram involving rectangles whose area is proportional to the frequency of a variable and width is equal to the class interval. The frequency distribution defines how often each different value occurs in the data set. The histogram looks more similar to the bar graph, but there is a difference between them.
The list of differences between the bar graph and the histogram is given below:
| Histogram | Bar Graph |
| The frequency is shown by the area of each rectangle | The height shows the frequency and the width has no significance. |
| It shows rectangles touching each other | It consists of rectangles separated from each other with equal spaces. |
Let's illustrate Histogram with an example.
How to determine how many students enrolled for Scholarship in different age groups.
Step 1. In Impact Cloud Dashboard, to create a chart, click on the Chart tab from the Home screen. You can alternatively click on the + symbol to open the Chart submenu and click on Chart to create one.

Step 2. For this example, select the following
Dataset : Scholarship data
Note: It is physical dataset .
Popular charts or All Charts: Histogram Chart
Finally, click on Create New Chart at the bottom right-hand side.
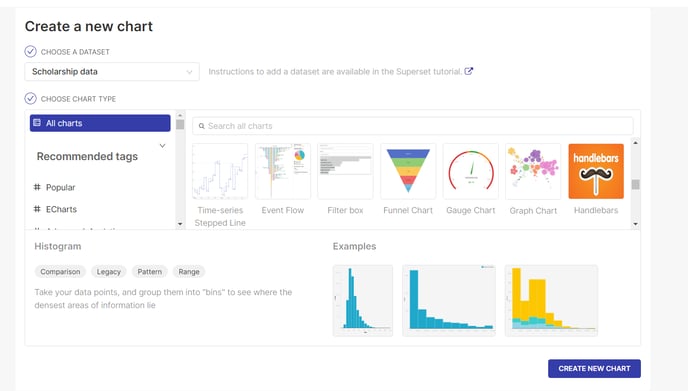
NOTE: It is mandatory to select the dataset and chart type to create charts
Step 3. In this example, select the below:
Query
Columns: Age
Click on the Create Chart button.
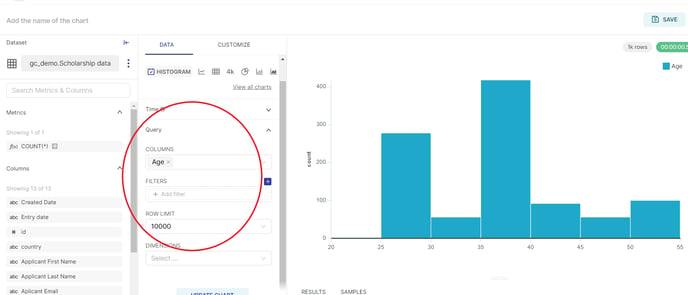
Remember: Selecting Columns is mandatory to create a Histogram Chart
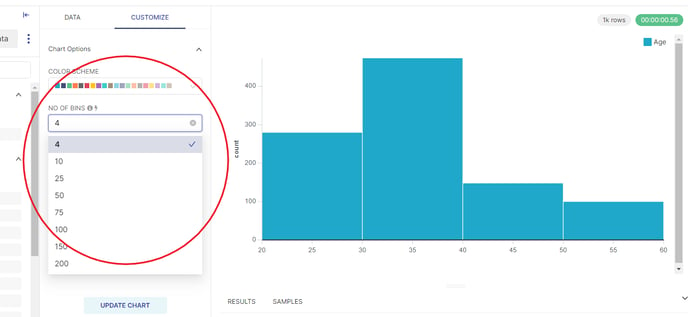
Step 4. Let's Navigate to Customize to manage the bins. The number of bins limits the granuality. You can change the number of bins as shown below.
Number of bins : 4 will arrange the data in bins of 4. By default it is 5.
Step 5 : The visualization for Histogram is created that shows the frequency of students enrolled in each age group arranged in bins. Let's save the chart as "Age group" to the dashboard "Demo"
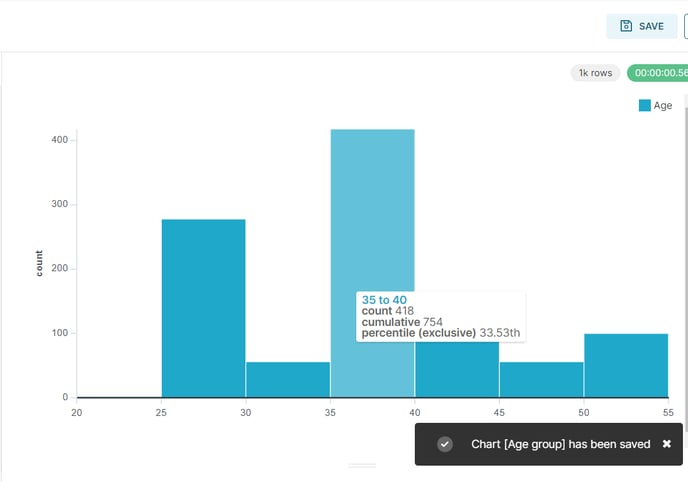
Congrats !! You have learned to create a Histogram.