
Problem: You want to assign specific colors for labels in a particular dashboard.
To assign a specific color to a label or value in a dashboard you should edit the dashboard properties.
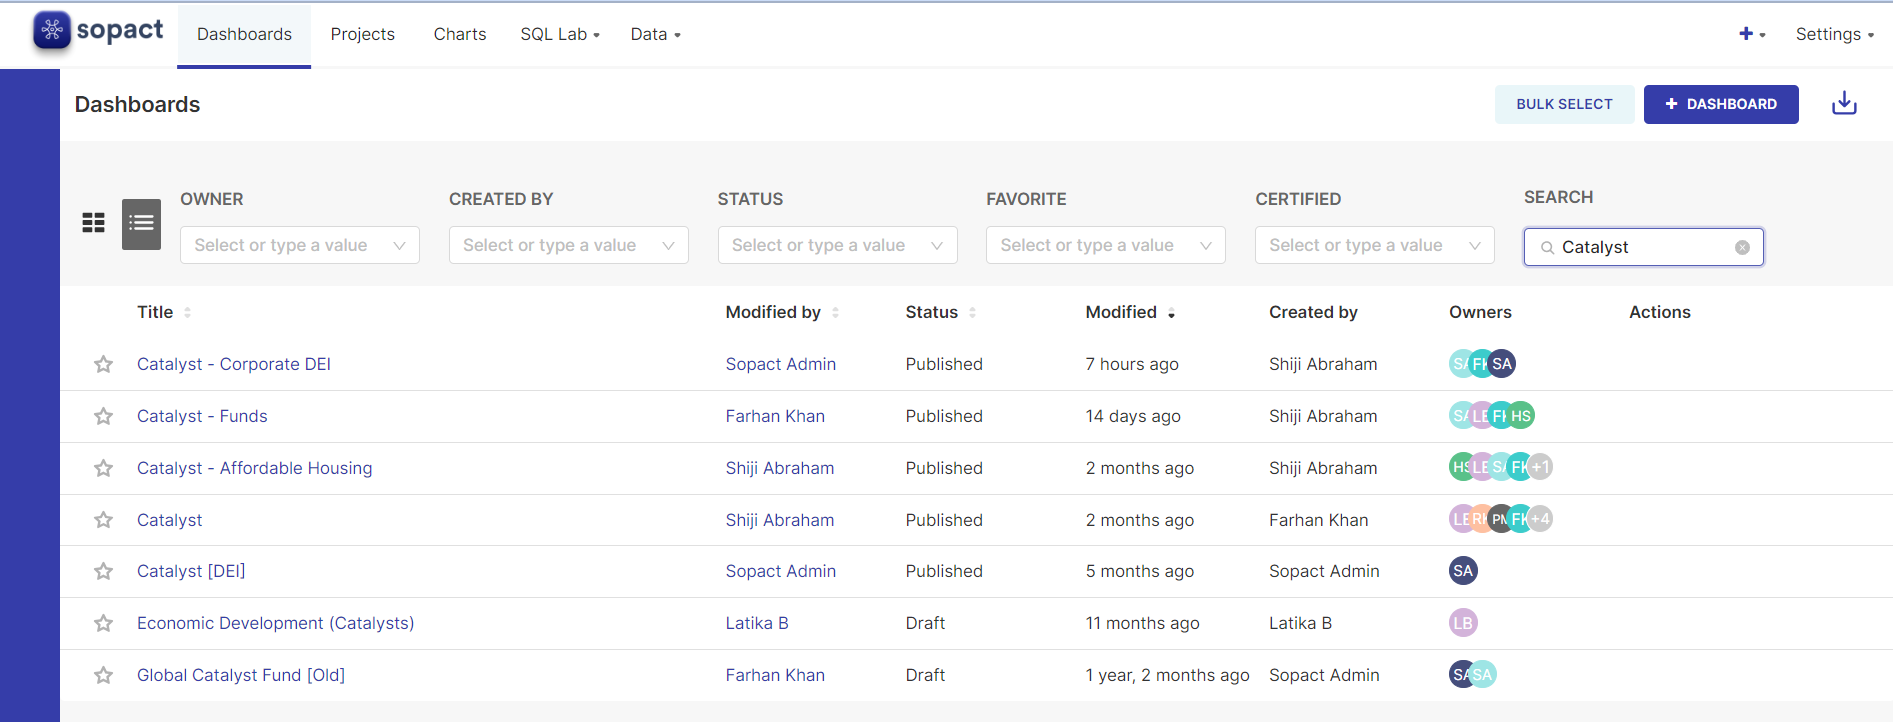
Step 1: Go to Dashboards to see the list of your dashbaords.
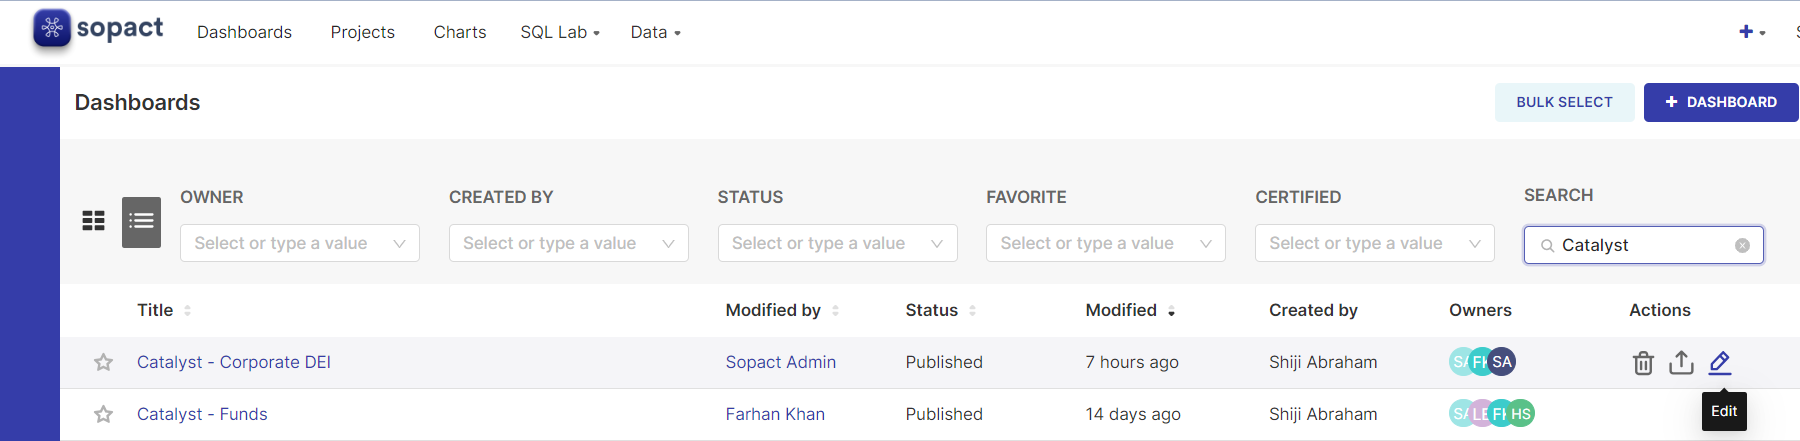
Step 2: Hover to the right side of the dashboard that you want to edit and click on the pencil icon that appears to see the Dashboard Properties.
Step 3: Scroll down and click on "Advanced" to display a field where you can edit the
JSON Metadata for the dashboard
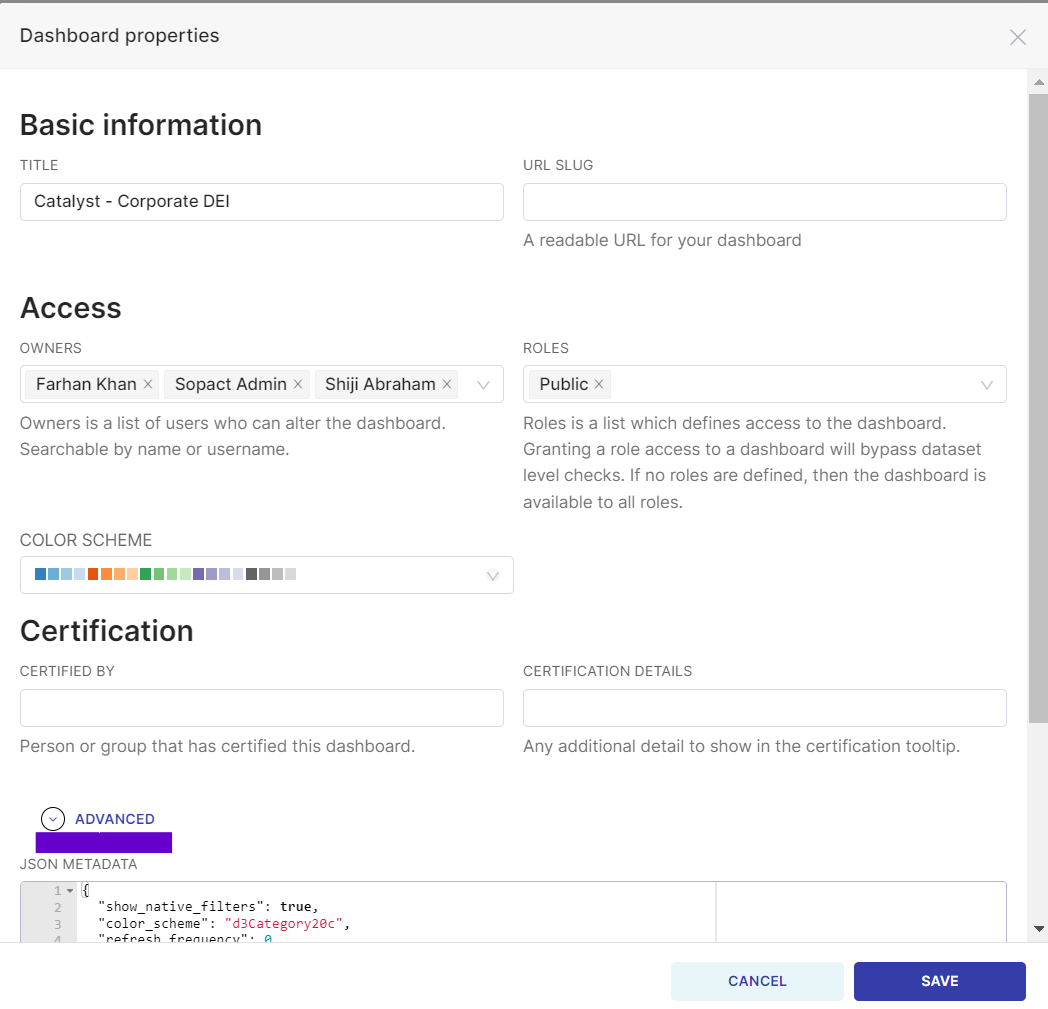
Step 4: In that field, you'll be able to edit specific label colors. To do that, you'll have to edit the code that appears over there. You'll focus on the line showing "label_colors": {} the rest should remain as is.
To do this, you'll add the label text followed by the desired color hex code as in this example:
- In this example we want to change the colors of each value to match the labels.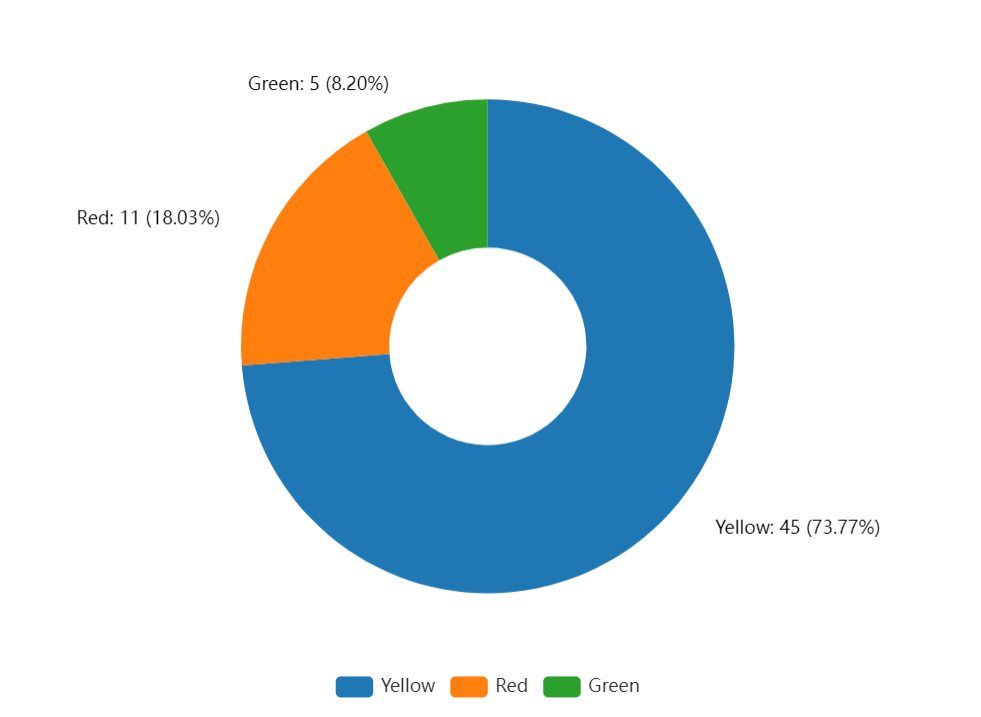
For this we add the following labels followed by the desired hex code to the JSON metadata field:
{
  "timed_refresh_immune_slices": [],
  "expanded_slices": {},
  "refresh_frequency": 0,
  "default_filters": "{}",
  "label_colors": {"Green": "#68BB59", "Red": "#E3242B", "Yellow": "#FFA500"},
  "color_scheme": null
}
After saving these changes, the chart will reflect the new colors in the dashboard:
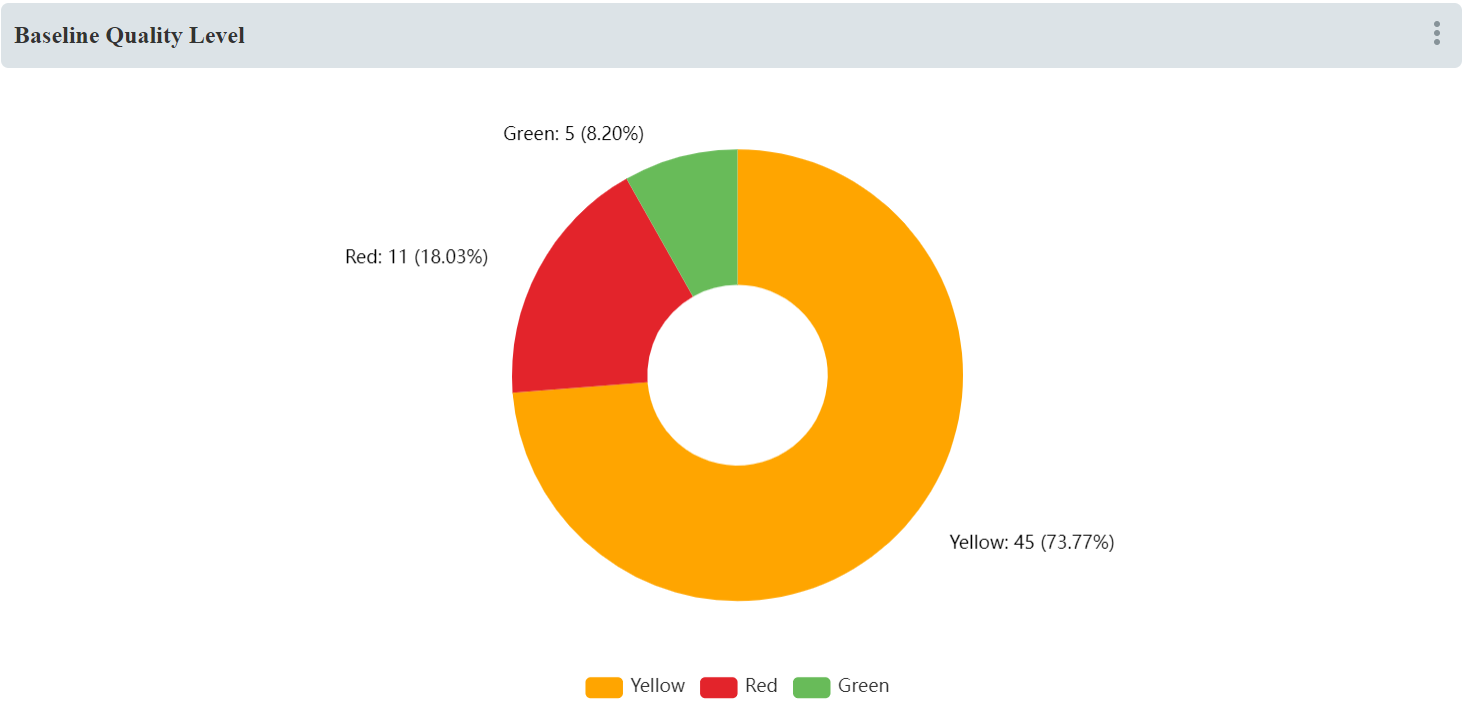
Caution: Keep in mind that this code will affect the entire dashboard. So if there are any other similar labels in other charts, these will also be affected. This can work to your benefit if you want to keep uniformity in your dashboard as well.