
In this article, you will learn how to organize and format your dashboard to give it a friendlier look and incorporate more design elements.
Introduction:
The components are building blocks of a Dashboard. They are used for creating sections, adding an image to display graphics. These components are used to add text to emphasize important data, make your dashboard more scannable and tell a more compelling data story.
Let's understand some of the important components :
Step 1. Open any dashboard. For example, open the Scholarship Demo dashboard. Click on the pencil symbol on the top right-hand side.

Step 2. This will open the Dashboard component pane as shown below:

NOTE: To add any component, click on the required objects in the component and place them in the desired location of your choice. The component will be added based on its property.
TABS.
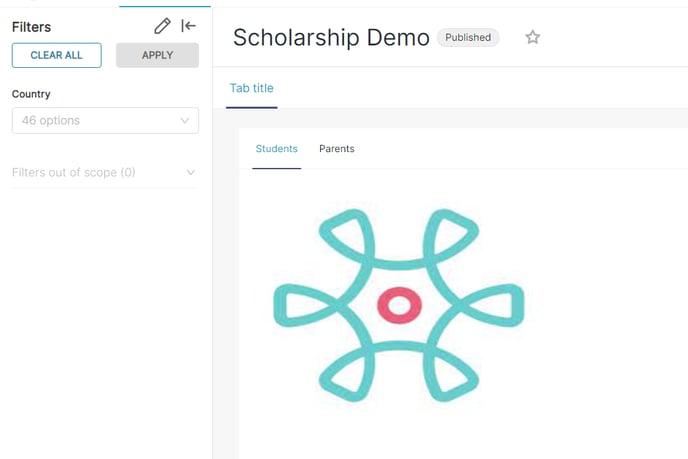
This component is used to create sections vertically as well as horizontally within a dashboard.
Each section can be used to display visualizations for different stakeholders/categories etc. for example a section for Students and another section for parents as shown below:
Note : Charts must be dropped on the specific tabs to ensure that visualization appears appropriately.

HEADER.
This component adds a header to a visualizations/group of visualizations. This header can be set to Small, Medium, and Large based on your requirement.

MARKDOWN.
This is an important widget. This widget can be used to enrich your data visualization using text, images, graphics, and video to emphasize important data, make your dashboards more scannable, and tell a more compelling data story.

Some of the tags commonly used with Markdown:
1. Bold the text: <b> Test1 </b>
2. Italic the text: <i> Test2 </i>
3. Insert a single line break: <br>
3. Increase / Decrease the font size ( Less the # font size increases): ######
4. Add a image: <img src= "image source URL" alt="text">
5. Embed a video:
Steps to Add an image
1. Enable public access for the image that needs to viewed on Dashboard
NOTE :
Enable public access of image on Google Drive
1. You can upload the desired image to a Cloud hosting application (such as Google Drive) to add it to your dashboard. After uploading it to Google Drive:
2. Change the sharing settings to Anyone with the link.- Copy the image URL - it should be as follows : https://drive.google.com/file/d/[FileID]/view?usp=sharing.
Get the [FileID] from the link, and replace it on this structure: https://drive.google.com/uc?export=view&id=[FileID] .
2. Copy and paste this HTML tag in the Markdown using the syntax as shown below :
<img src="https://drive.google.com/uc?export=view&id=1eoOz9rpxftXKk0E8L30MNCM6YCqkWlq" width="100%" height="100%"/>
Once done, it will be displayed as shown below:
Steps to embed a video:
- Upload the video to YouTube, which you want to Embed.
- After uploading play the video on the youtube website. You can choose any video uploaded by any other person also.
- Right-click over the video, a menu will open.
- From the menu, click copy embed code.
- The Youtube video URL is now copied, just paste this code in the body of the webpage. The video will get displayed where the code was pasted.

ROW.
This component will add a blank row to add any visualization or any component horizontally.
COLUMN.
This component will add a blank column to add any visualization or any component vertically.
Remember to save the change once the component is added to the dashboard!!