
In this article we will look at how to structure the data from the point of view of data analysis and how it differs from the way data is typically saved on spreadsheets from operational stand point
Problem
When it come to data analysis and visualization, how the data is collected and stored plays a foundational role in what sort of analysis can be performed on the data. Having an idea of the foundational concept is a MUST to efficiently do data analysis.
Solution
In this section we will go through the fundamental concepts.
Throughout this and other articles we will frequently refer to some terminologies. Lets look at what they are
Table: This is also same as dataset, but is directly stored in the database. For example, any data you collect on the survey would be stored on Impact Cloud table, which ultimately become dataset on the visualization platform before creation of charts and graphs.
Dataset: These are fundamentally tabular data (think excel/google sheet with rows and columns). All the data you collect from various sources results in data being stored in datasets. Datasets can combine data from multiple tables.
Data: The rows of data within a table and the dataset.
To use any tool focussed on data analysis, how the data is structured plays a very crucial role. Data analysis tools generally have a database where the data gets stored. Typically they are relational databases. To use the latest version of Impact Cloud, you would need to have data in a tabular format. Think excel or google sheets with rows and columns.
Have a look at the screenshot below.

Column name refers to columns in a dataset (which are typically headers) while column data are the rows of data available.
Headers should appear in the first line of the excel/google sheet like its shown in screenshot above
How is this different from what we do on excel and google sheets when saving operations data on it?
Strict datatypes:
When we use google sheet or excel for saving operational data, we typically use it free form. Meaning we could have data stored in this way. for example, in the Men Engaged column we have a numeric data and then an "NA". While this is ok in excel or Google sheet but in databases, this will be a problem as databases have strict datatypes. For example, Men Engaged is a "numeric" type and in a numeric data type you won't be able to enter "NA" which is basically a character.
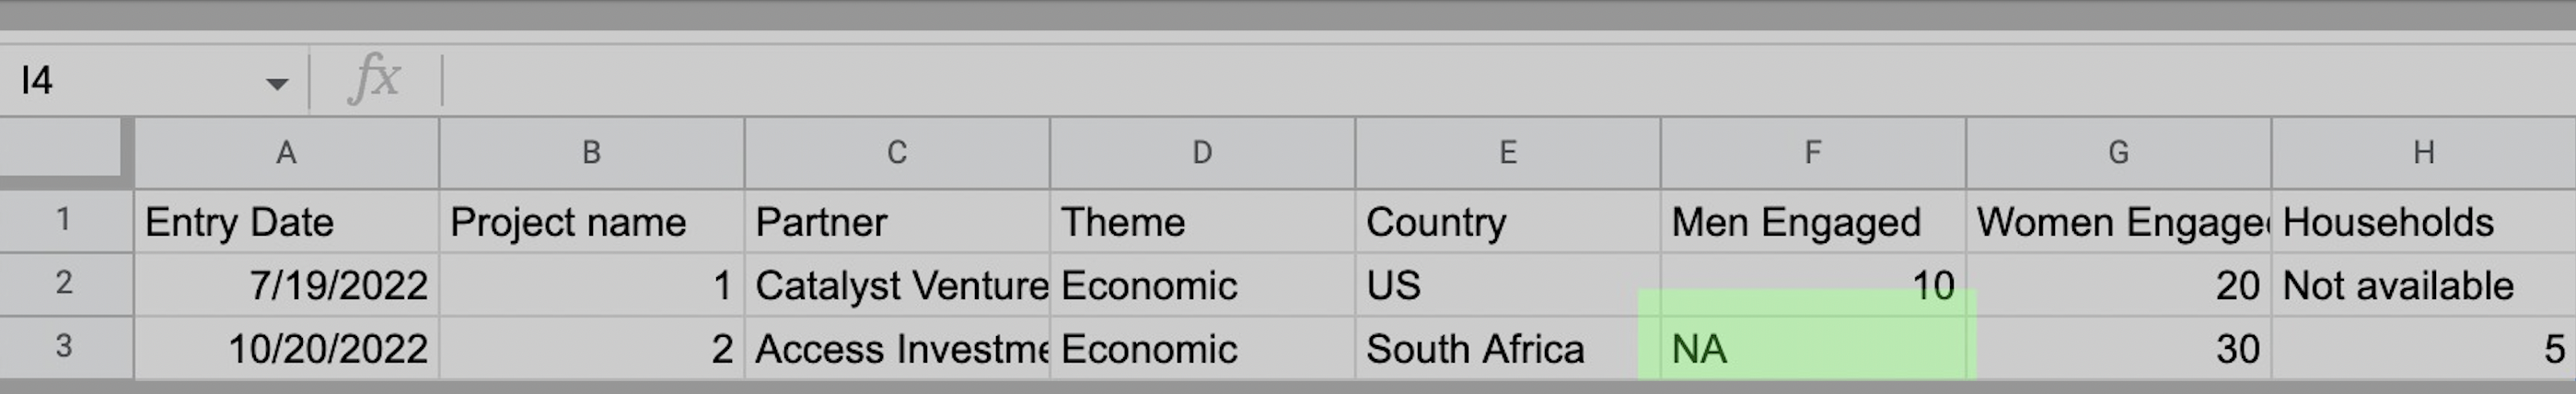
So for successfully storing the above information in the Impact Cloud DB, the data needs to look like so
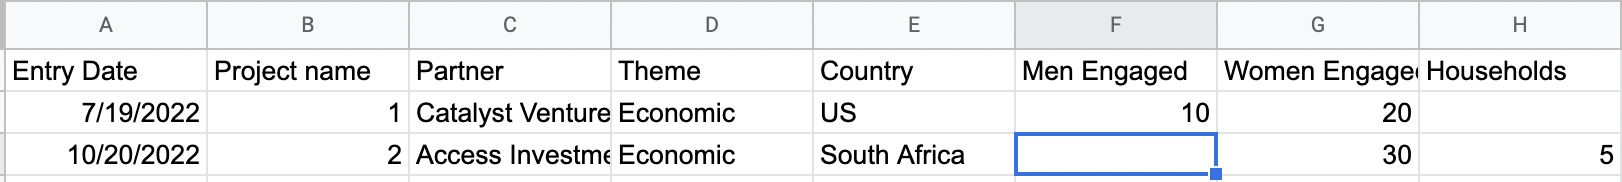
Also, for the column "Men Engaged" since it is a numeric column it cannot have any symbols in the data. For example, if the value is 1000 in one of the rows, it should not be formatted with comma, for example it cannot be "1,000". It MUST just be numbers like so 1000.
Column names (Header row):
A second consideration is to not have any special characters such as "% & / , : ;" in the column headers. Basically anything other than letters and numbers can be a potential problem. The safest character to use is an underscore "_".
For example, we should avoid a column such as "Men Engaged %" and should simply have "Men Engaged".
There should be only one Header row in any given excel/google sheet.
Data structure (data modelling):
Not every data structure lends itself to all kinds of visualizations.
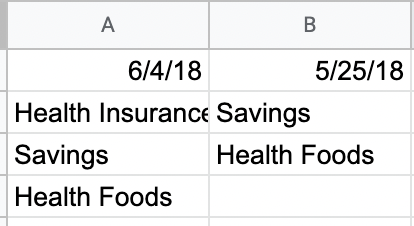
For example, to create a visualization such as the one below
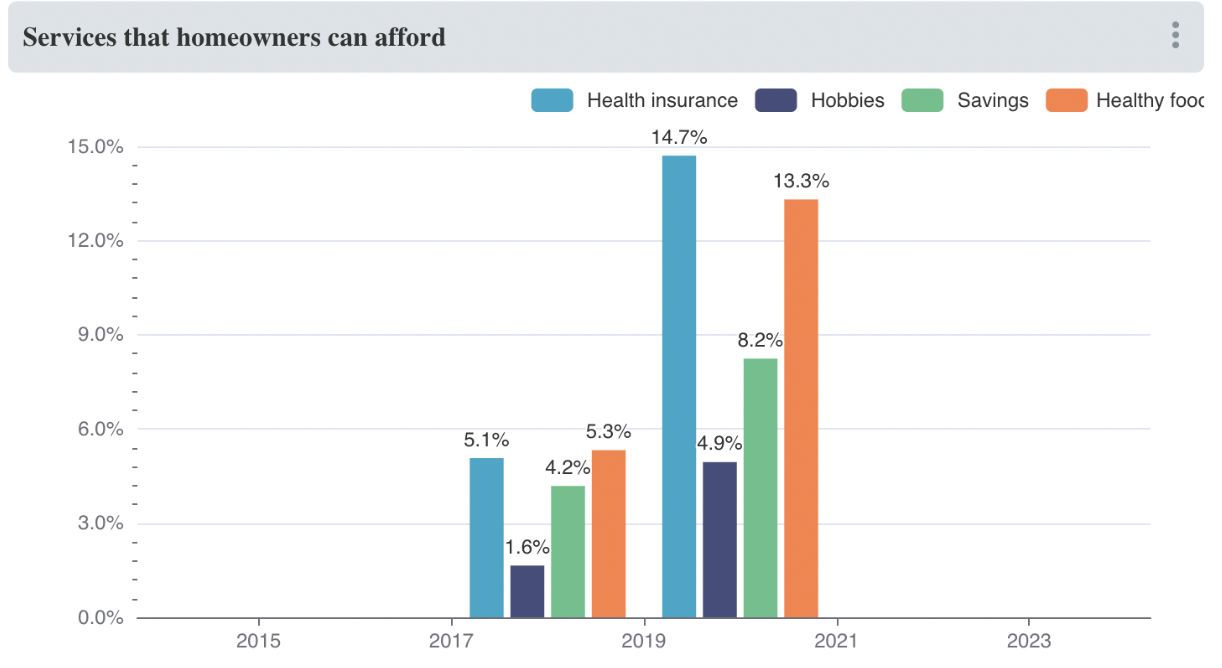
Your data needs to be structured in this way
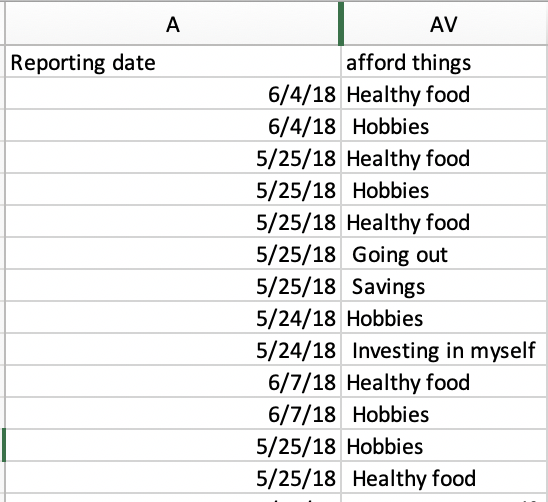
Or it could be in the following format:
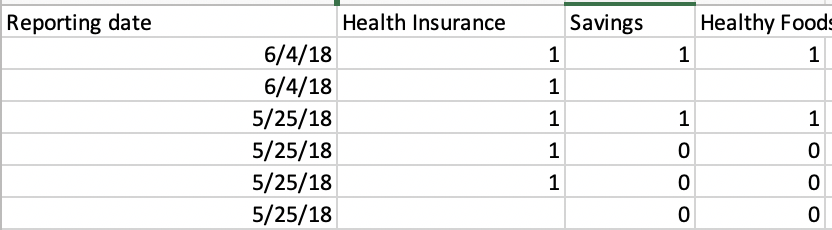
But it cannot be
In further sections, where ever applicable we will present an ideal data model for different scenarios that you may want to accomplish. For example how to compare target vs baseline? The way to structure the data on an excel or google sheet.