
This article shows you the requirements and best practices when preparing and cleaning a table before importing it into the Impact Cloud to make it ready for analytics.
Introduction
Impact Measurement and Management (IMM) relies on data analytics to be able to perform the "Measurement" part. Data analytics allows us to perform calculations with large data sources to obtain insights about a specific topic. In social impact, we often refer to this as Impact Analytics or Impact Data Analytics, and our large sources of data come in the form of volunteer or stakeholder surveys, operational data from spreadsheets or CRMs like Salesforce.
For Impact Data Analytics, we rely on the input of tables of standardized data that can be analyzed swiftly by implementing mathematical operations which can be applied to a specific table and then keep updating the results as the data grows.
Think of this as the formulas in Excel, which are applied to columns and get updated if the values in the cells change. It is largely similar, with the difference that a human is not looking at the data to continuously fix spelling mistakes or edit the table, so we need these tables to be well structured, clean and standardized we can before implementing the formulas to make sure they work correctly.
Preparing your data to import it into Impact Cloud
Before we proceed, let's take a look at some definitions.
Basic terminology for data:
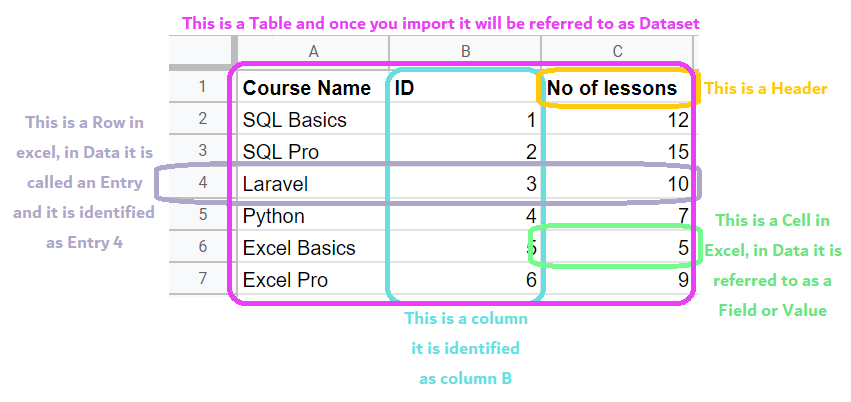
Now that we are on the same page...
What do we mean by structured?
We are all used to working with spreadsheets that look like this:
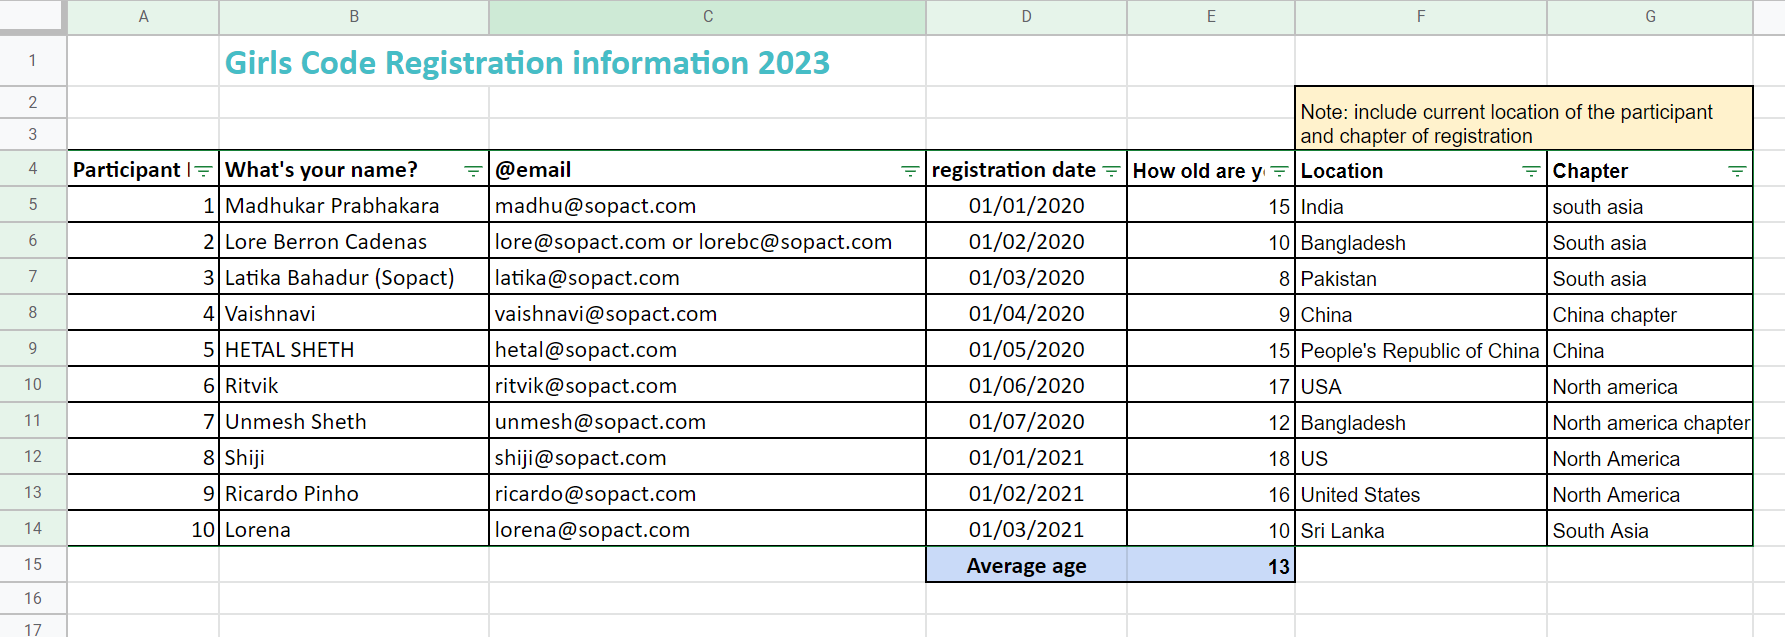
And it works well when humans are looking at it, but to make it usable for data analytics tools such as Impact Cloud, we need to think "vertically". So we need to get rid of any:
- Titles
- Blank spaces above the headers (this means all the headers should always be on row 1)
- Merged cells
- Calculations or Totals at the bottom of the last entry
- Filters that can be hiding data (it's better to delete the entries we don't want to include)
*Borders, fonts, colors and sizes are automatically ignored so we can also get rid of those or just leave them.
An structured table looks like this:
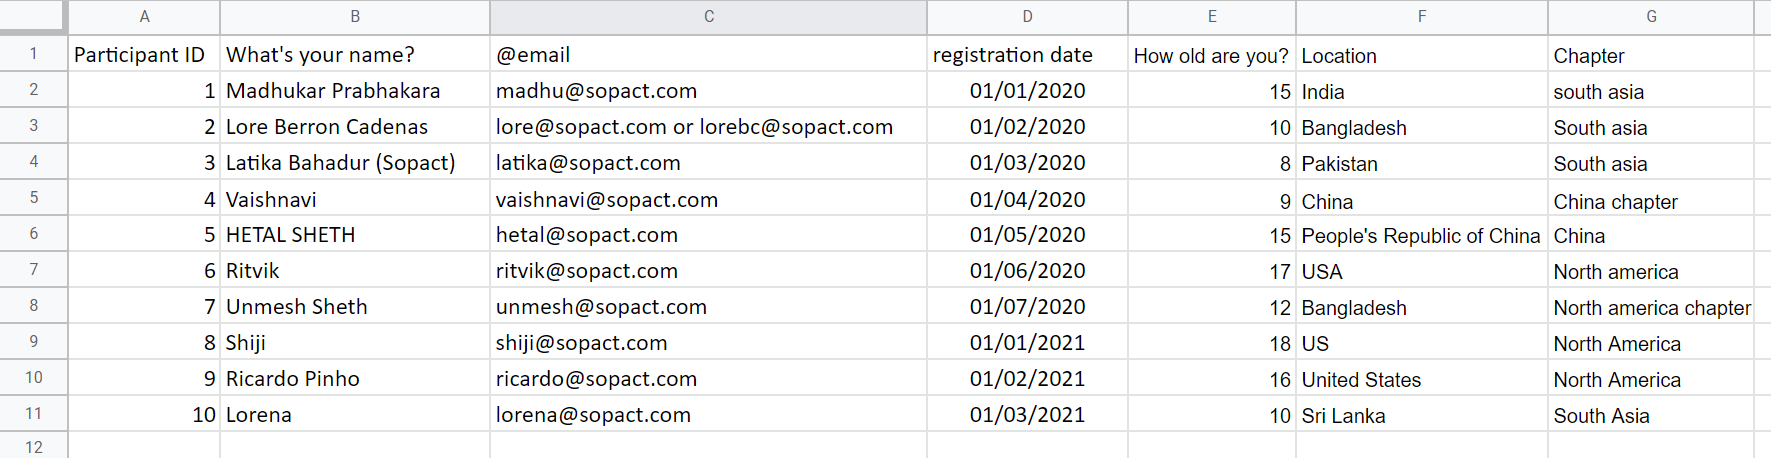
Now the next step is to clean it.
What do we mean by clean?
Since our data will be processed with math formulas (specifically postgreSQL queries) we need to avoid any confusions and discrepancies in our data. We need to make sure our data speaks the same language as the platform. For that, we need to keep in mind that:
- Each column should contain only one type of data:
- text entries, called STRING or CHAR (for character) depending on the length
- numerical entries can be integers (INT) or decimals (FLOAT for floating point)
- dates can be in date + time format (TIMESTAMP), only DATE, or only TIME
- Special characters should be avoided as they may have a mathematical meaning (*, /, +, -, %, ", ' , (), &, etc.) for headers and entries.
*Exceptions are: underscore _ and @ . when use in strings such as email. - Percentual quantities should come in decimal format
- Dates must be in 'mm/dd/yyyy' format
- Headers have to be unique (otherwise, the formulas won't be able to tell between the two)
- Headers must not have final spacing or double spacing in between (it's hard to notice for performing calculations)
- For implying that data is not available, or is zero, just leave the empty field (avoid NA, N/A, etc)
Tip: Use this as a checklist whenever you want to clean your data.
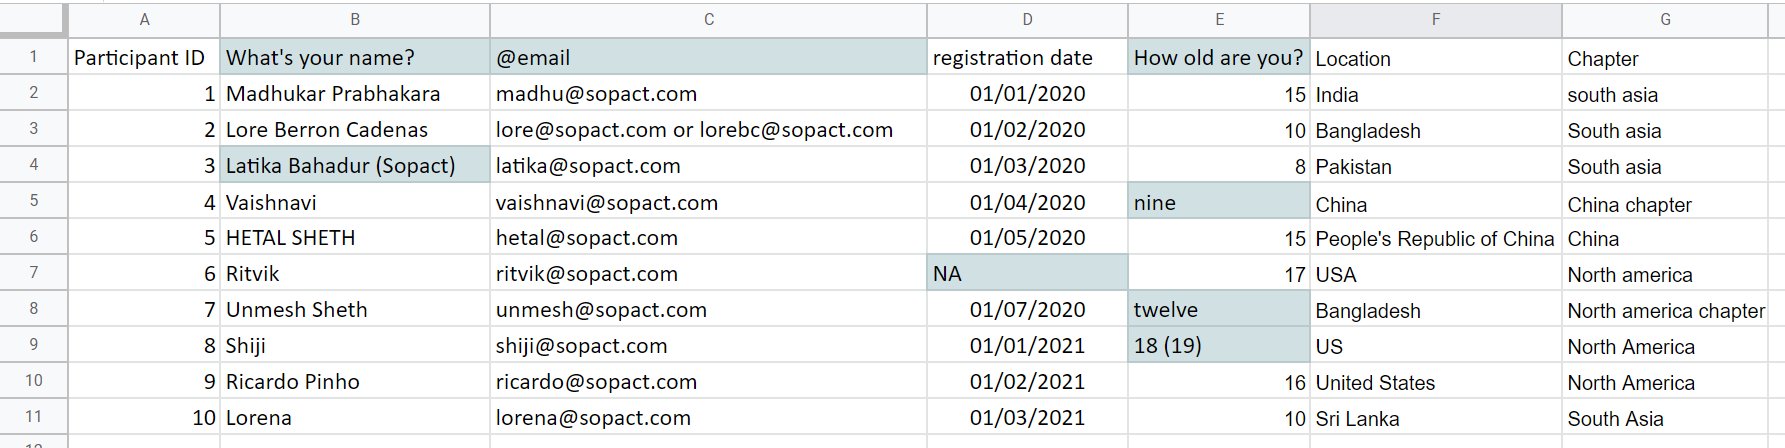
Let's look at the before and after for our structured table:
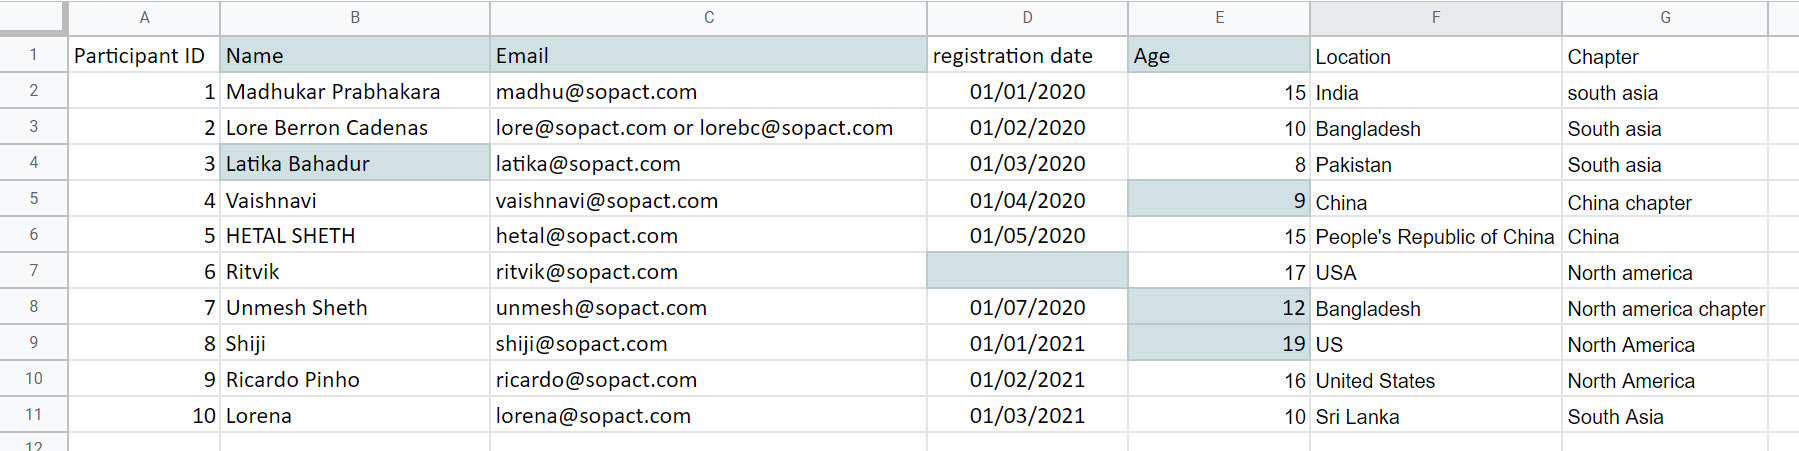
Before cleaning:
After cleaning:
This table has now been cleaned, so we won't run into any issues when importing it into the platform, as they are using the same language . But for analyzing it, we still need to standardize all the values in each column.
What do we mean by standardized?
It means that all the data in one column looks the same way and follows the same format, which will allow us to break them into categories to perform calculations and create good looking visualizations.
In the example we're using, we can see that the values for column Name are not standardized. There are (1) only first names, (2) first and last names, (3) capital and small letters, and (4) all caps. So any visualization that we create will also reflect that.
📊
This is a style problem, but it has a greater impact when you want to categorize data to create calculations. This is what would happen with Location, as there are 2 versions for China, and 3 versions for United States, hence, will be considered separate locations, and if we wanted to obtain a calculation for "Participants per Location" it would look like:
📊
Data is difficult to edit once we are already analyzing it, so we want to tackle this before hand. Remember that all the values for each category must be written in the same manner, considering:
- Unified terminology (US vs. United States vs. USA and North America vs. North America Chapter)
*This is also common when tracking SDGs (1. No Poverty vs. 1 - No Poverty vs. No Poverty) - Capitalization (HETAL vs Hetal)
- No final or double spaces, which can cause the same separate classification issue ('United States ' vs. 'United States' vs. 'United States')
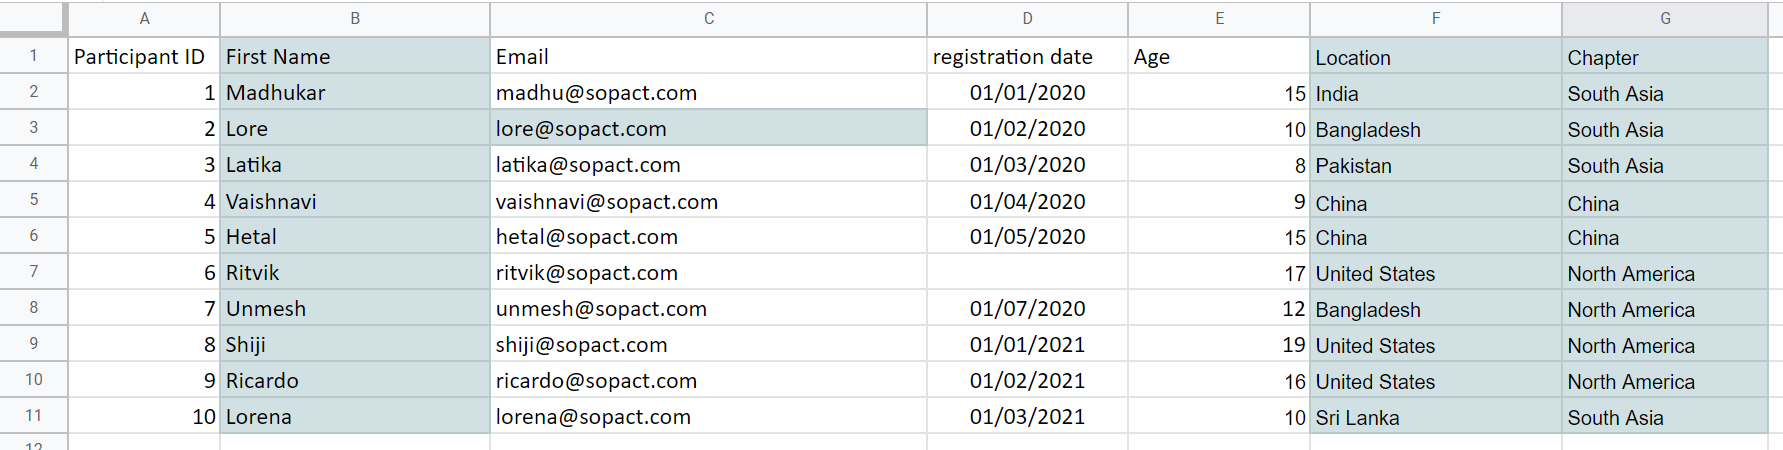
Our final structured, clean, and standardized table looks like this:
The final step in preparing your data is making sure that you name it and save it correctly. Up to this point, the same applies to both sources of data tables (Excel and Google Sheets). For saving each correctly you should make sure you know how each works.
Saving an Excel table
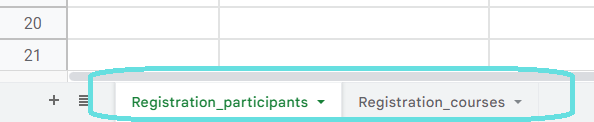
For importing Excel files, each tab or sheet gets imported separately. So we recommend you only have one file with one sheet, and both are named the same.
Remember each import will bring one sheet (or tab) only.
Saving a Google Sheet
For Google Sheets (GS) you can import all your sheets at once, or only select the ones you want to import for each file. But each will be considered a different table, and so, you should name each Sheet as you want the table to be identified.
We recommend you avoid spaces and use underscore instead:
Now that your ready to be imported into Impact Cloud, check out our tutorials for:
- Importing Google Sheets
- Importing Excel files