In this article we will walk you through the techniques needed to combine data from two or more datasets. We will explicitly look at the UNION available in SQL to achieve the purpose.
Problem
You have data in two or more sources/spreadsheets, and the analysis you're attempting requires data from the two sources to be combined in some way.
Before going through this article we strongly recommend that you go through the following articles
Consider an example to better understand the problem statement:
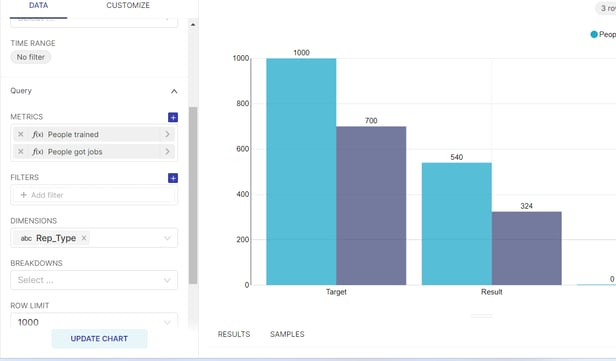
To create a visualization as shown below :
This will help us to compare the Results achieved against the Targets for Number of people trained, and Number of people who got jobs
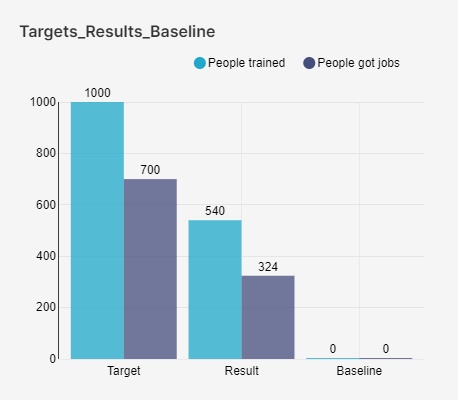
For this scenario: Data residing in two datasets from different sources are considered. The data files are listed below.
Targets_Baseline Source - Excel File
This file stores all the information related to Targets and Baseline for each project
Results_Survey - Source - Sopact Survey
This file stores the information collected at specific intervals from the portfolios against specific metrics.
A sneak peeks at the columns, and the data of these datasets are referred to in the forthcoming section.
Targets_Baseline
| Project | Rep_Type | Period | Funding_amt | Number_people_trained | Number_people_got_jobs | Income_generated | Hours_training |
| Girls Code | Target | 3/31/2023 | 70000 | 1000 | 700 | 175000 | 200 |
| Girls Code | Baseline | 4/1/2022 | 0 | 0 | 0 | 0 | 0 |
Results_Survey
| Project Name | Reporting Date | Funding Executed | Funding executed - Currency | Number of people trained | Number of people placed | Hours of training | Income Generated | Income Generated - Currency | Learnings | Rep_Type |
| Girls Code | 6/30/2022 | 2000 | GBP | 100 | 34 | 20 | 4500 | GBP | This the first quarter so low training | Result |
| Girls Code | 9/30/2022 | 15000 | GBP | 200 | 120 | 50 | 30000 | GBP | Second quarter learnings | Result |
| Girls Code | 12/31/2022 | 17000 | GBP | 240 | 170 | 50 | 42500 | GBP | Third quarter learnings | Result |
Problem statement for this use case : We need to compare the Total Number of people trained and got jobs stored in dataset "Result_survey" against the Targets which resides in different dataset "Target_Baseline"?
Solution
To accomplish this, we need to combine data that reside in different datasets into one dataset and then compare the column ( These datasets can be from different sources: surveys, excel file or google sheets too).
The solution can be achieved using two steps, as shown below :
Step 1. Combine Targets_Baseline and Results_Survey datasets as one dataset
Step 2. Compare the Number of people trained and Number of people who got jobs columns based on the Type.
The result of the output of Step 1 is as shown below : ( After combining both the datasets)
| Project | Period | Number_people_trained | Number_people_got_jobs | Rep_Type |
| Girls Code | 3/31/2023 | 1000 | 700 | Target |
| Girls Code | 4/1/2022 | 0 | 0 | Baseline |
| Girls Code | 6/30/2022 | 100 | 34 | Result |
| Girls Code | 9/30/2022 | 200 | 120 | Result |
| Girls Code | 12/31/2022 | 240 | 170 | Result |
Important Question: “How do we combine the data that resides in different datasets, "Targets_Baseline" and "Results_Survey" to get the desired output as shown above”?
Purpose
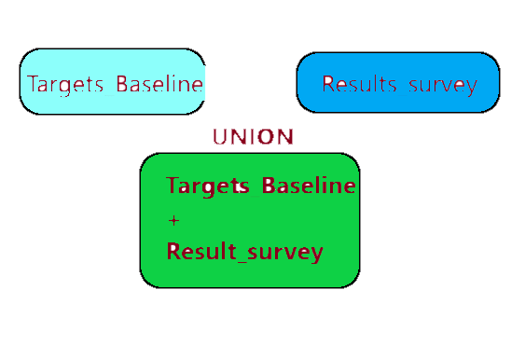
This is precisely what the UNION ALL operator does. It provides instructions to combine results of both the datasets/tables ( Targets_Baseline and Results_Survey) and get desired columns into one dataset. In simple terms, it combines the two or more datasets into one dataset. Such datasets are called Virtual datasets. Diagrammatically, it can be represented as follows :
Step 1 : Fetch specific column information from first dataset i.e.Targets_Baseline
The SELECT statement should look like as shown below
 SELECT "Project","Period",  "Number_people_trained",
"Number_people_got_jobs", "Rep_Type"
FROM "Targets_Baseline"
Note : Include column names "Project", "Period", "Number_people_trained", "Number_people_got_jobs", "Rep_Type"
Step 2 : Fetch specific column information from second dataset i.e.Results_Survey
The SELECT statement should look like as shown below
SELECT "Project Name","Reporting Date" , "Number of people trained",
 "Number of people placed", "Rep_Type"
FROM "Results_survey"
Note : Include column names "Project Name", "Reporting Date", "Number of people trained", "Number of people placed", "Rep_Type"
The Final query to combine both the datasets using UNION ALL should be as follows :
-- Query from Step1

SELECT "Project","Period",  "Number_people_trained",
"Number_people_got_jobs", "Rep_Type"
FROM "Targets_Baseline"

UNION ALL

-- Query from Step2

SELECT "Project Name","Reporting Date","Number of people trained",
"Number of people placed", "Rep_Type"
FROM "Results_survey"
TIP : Only select relevant columns from the dataset
THE Syntax for UNION ALL SQL Query
SELECT column1, column2, ... column_n
FROM schema_name.table_name
UNION ALL
SELECT column1, column2, ... column_n
FROM schema_name.table_name
UNION ALL
SELECT column1, column2, ... column_n
FROM schema_name.table_name
And so on . . .
NOTE : In scenarios similar to above, Just replace column name1, column name2, column name3,.... with column names and with table names according to your datasets keeping an eye on the syntax . At the same time be mindful of points to remember stated below related to number of columns, datatype and order of column.
POINTS TO REMEMBER WHILE USING UNION:
-
Each table used within UNION must have the same number of columns.
-
Example : The first table "Targets_Baseline" has 5 columns in the
SELECT statment. The second table "Results_survey" also
should have 5 columns in the SELECT Statment
-
-
The columns must have same data types.
-
The columns in each table must be in the same order.
|
Column number & order
|
Targets_Baseline
|
Data type
|
Result_survey Column names |
|
1 |
Project |
Text |
Project Name |
|
2 |
Period |
Date |
Reporting Date |
|
3 |
Number_people_trained |
Number |
Number of people trained |
|
4 |
Number_people_got_jobs |
Number |
"Number of people placed |
|
5 |
Rep_Type |
Text |
Rep_Type |
SO LETS GET STARTED to combine the datasets as one dataset Using UNION :
Objective: Combine Targets_Baseline and Results_Survey datasets as one dataset
To accomplish this, follow STEPS A to E
STEP A:
Go to SQL Lab as shown below : ( We will be using the two datasets described above that are highlighted. You can see all the datasets from Datasets menu )

Step B: Navigate to SQL Editor from the Menu bar, Select the appropriate data and the schema as shown below. This information can be obtained and is highlighted in Red as shown above.
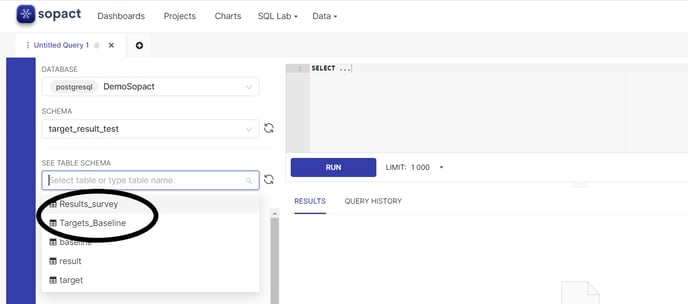
Step C: Now copy and paste the following query in the Right side space as shown below :
SELECT "Project","Period", "Number_people_trained", "Number_people_got_jobs", "Rep_Type"
FROM target_result_test."Targets_Baseline"
UNION ALL
SELECT "Project Name","Reporting Date" , "Number of people trained", "Number of people placed", "Rep_Type"
FROM target_result_test."Results_survey"
TIP: Please replace column names and table names according to your datasets, adhering to the syntax but being mindful of the datatype and order of the columns added.

Step D : Click on the RUN button and execute the query and get the desired output. The results circled below is the combined results from both the tables.
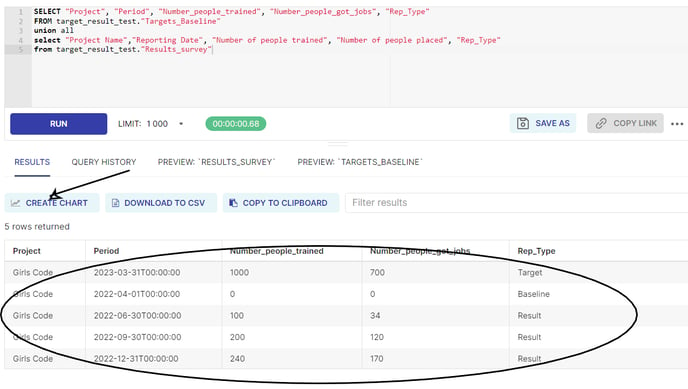
NOTE: Above circled results must be saved to create visualization, which is a combination of data from Targets_Baseline and Result_Survey for selected columns.
STEP E: To save these results into a new dataset, click on CREATE CHART. It will open up a dialog box, as shown below. Give it an appropriate name. Let's name it "Combined_datasets"
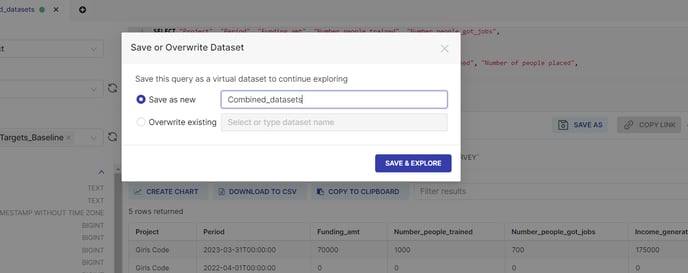
STEP F: Finally, "Combined_datasets" is created, shown below, a virtual dataset. This dataset has a combination of data from both the above-mentioned datasets.

Congratulations! Using the UNION ALL operator, you learnt how to join two tables to generate a virtual dataset.
Now, this dataset is ready to create the bar chart visualization for comparing Results against the target for Number of people trained, and a number of people who got jobs.
Follow the steps mentioned in the article Creating a visualization - Bar Chart.
Snapshot of steps required for creating a Bar Chart for comparing Results / Targets on metrics: Number of People trained, Number of people got jobs.
1. Select the dataset "Combined_datasets"
2. Select Bar Chart from the list of visualization
3. Metrics - Select Number of People trained and Number of people got jobs. Use SUM function
4. Dimensions - Select Rep_Type
5. Create Chart
