
This article will show you how to connect your Google Sheets to Impact Cloud to be able to use them as sources for your charts and dashboards.
Introduction
Google Sheets (GS) are a good way to store data and information that can be relevant for impact measurement, these sheets can be continuously used across teams and change and grow over time with new records or new columns. With this in mind, Impact Cloud allows GS to be imported into the platform and will automatically bring new records (rows) when the connection has been stablished. Also, whenever new columns are added, it is possible to add those new fields to keep your data up-to-date. All of this without damaging existing charts and dashboards. This article shows how to connect GS to Impact Cloud.
Connecting a Google Sheet for the first time
You'll need to add this GS to an existing or new project.
*If you're starting from an existing project skip to Step 2
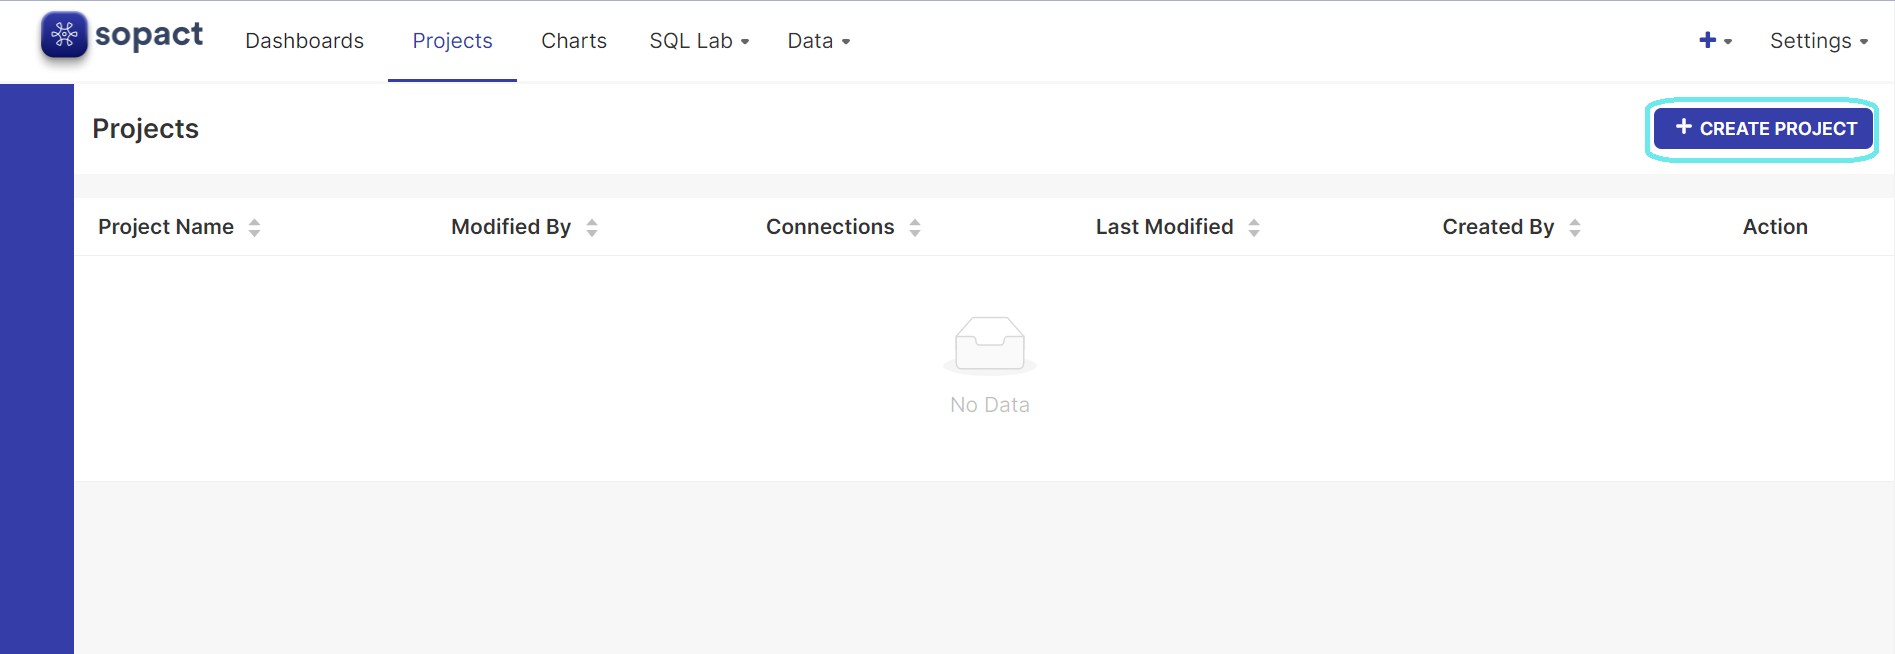
Step 1. Create a new project
- Go to "Projects" in the main menu.
- Click on "+ Create Project"
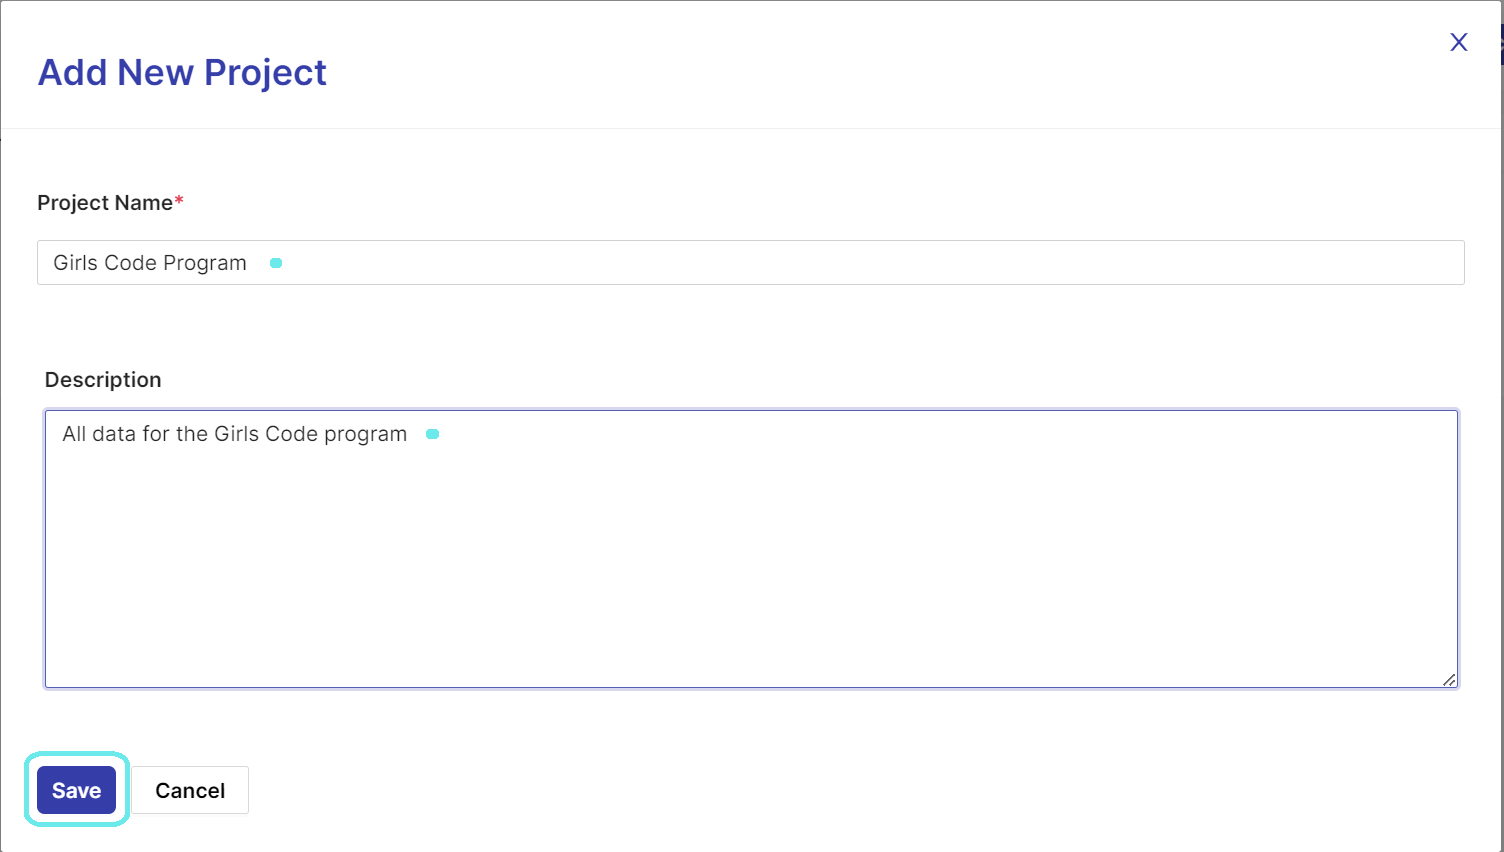
- Give a name and description to your new project and save it
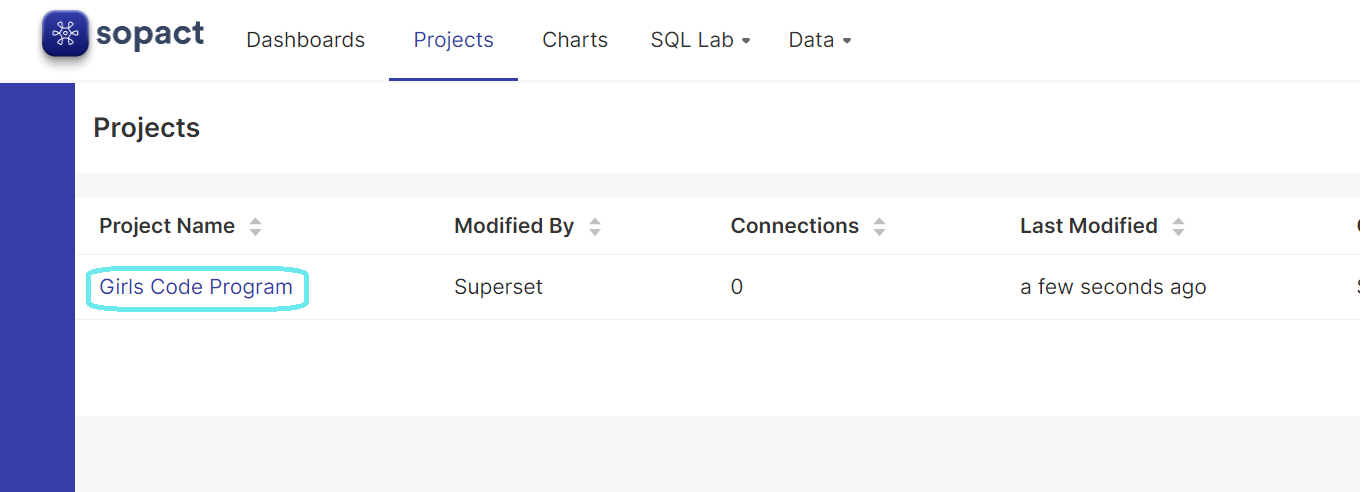
Once the project exists, you can add a new connection (in this case to Google Sheets) to that project.
Step 2. Create a New Connection in the Project
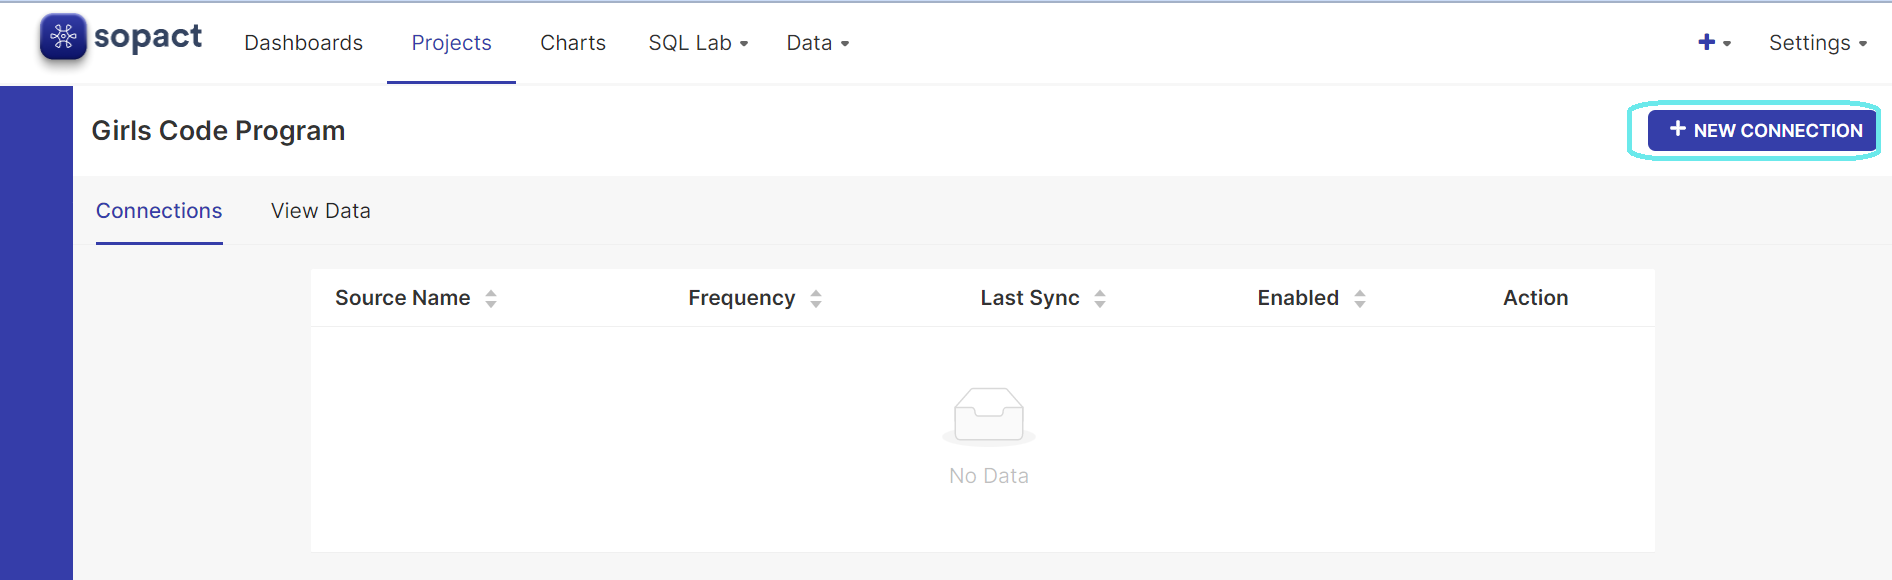
- Click on the project you want to add this connection to
- Click on "+ New Connection"
Step 3. Configure the new connection in the Connection Settings Menu
- Click on "Select Source"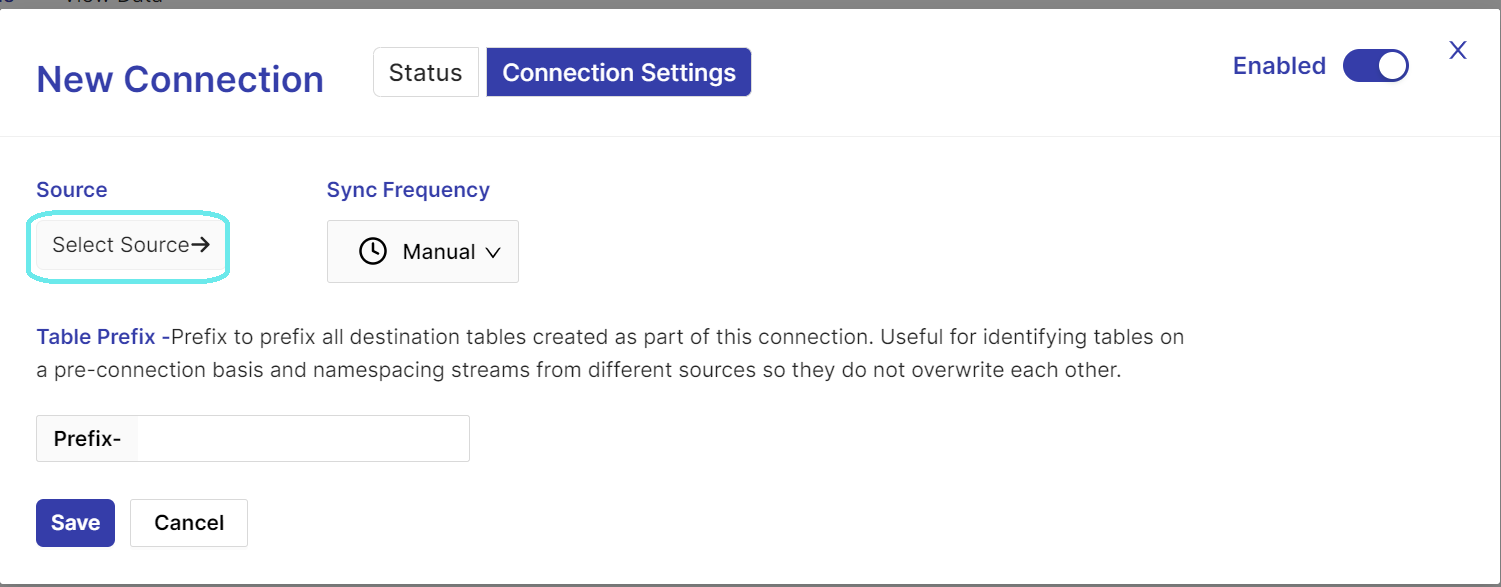
- Choose "Google Sheets"
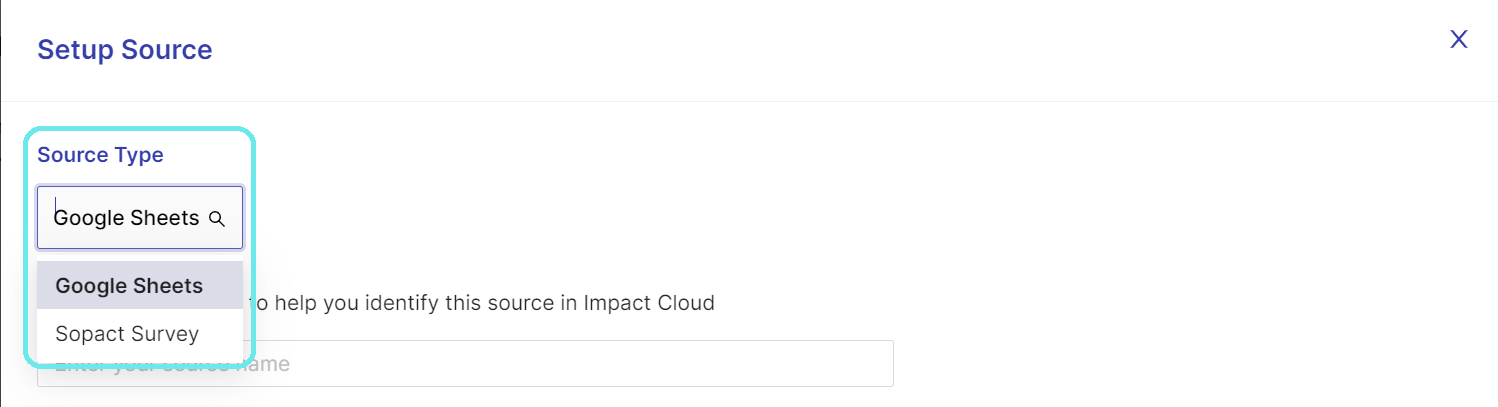
- Select a Name for this connection

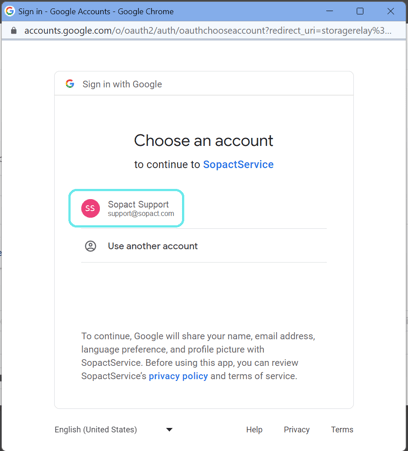
- Click on "Login with Google"
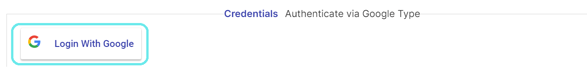
- Login with your Google account that contains this Google Sheet
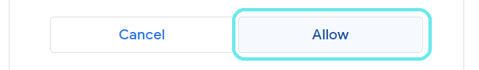
- Click on Allow to Sopact access to your Google Drive files and Google Sheets
You'll notice that the button now shows as: 
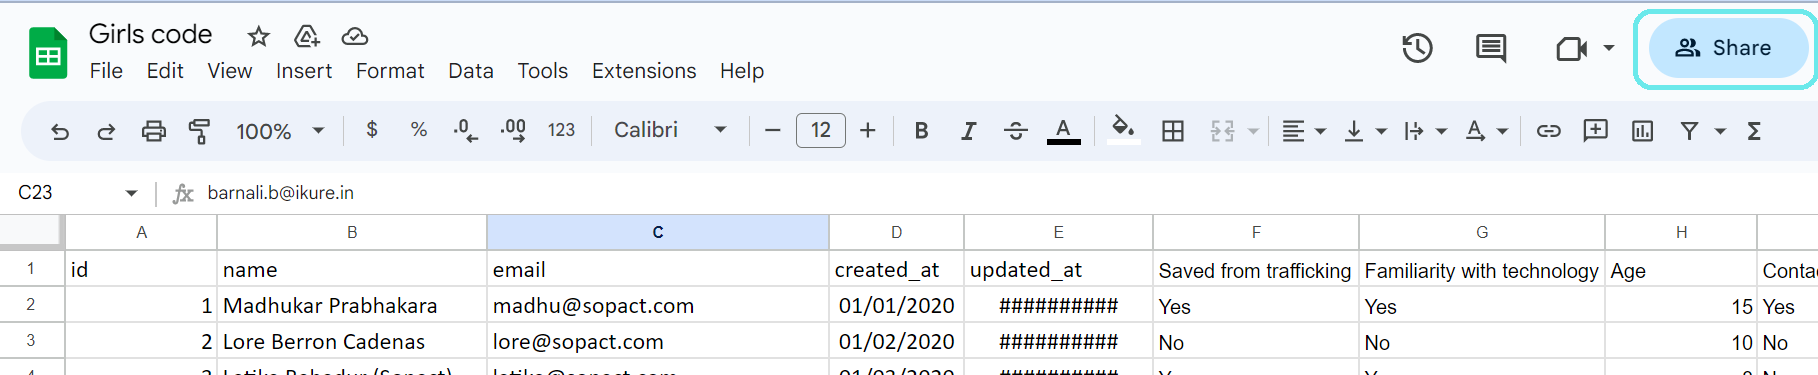
Step 4. At this point, you'll need to get the link to your Google Sheet
- In your GS click on "Share"
- Click on "Copy link"
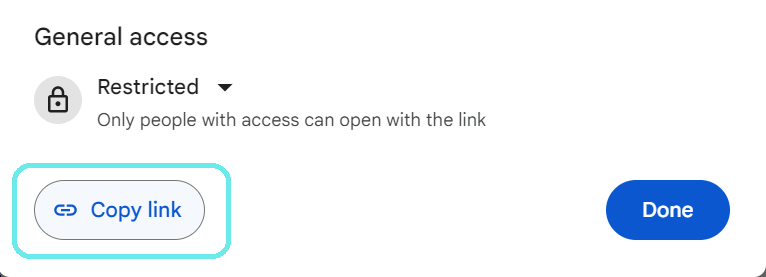
- Now that the link is copied to your clipboard you can go to back to Impact Cloud and paste the link
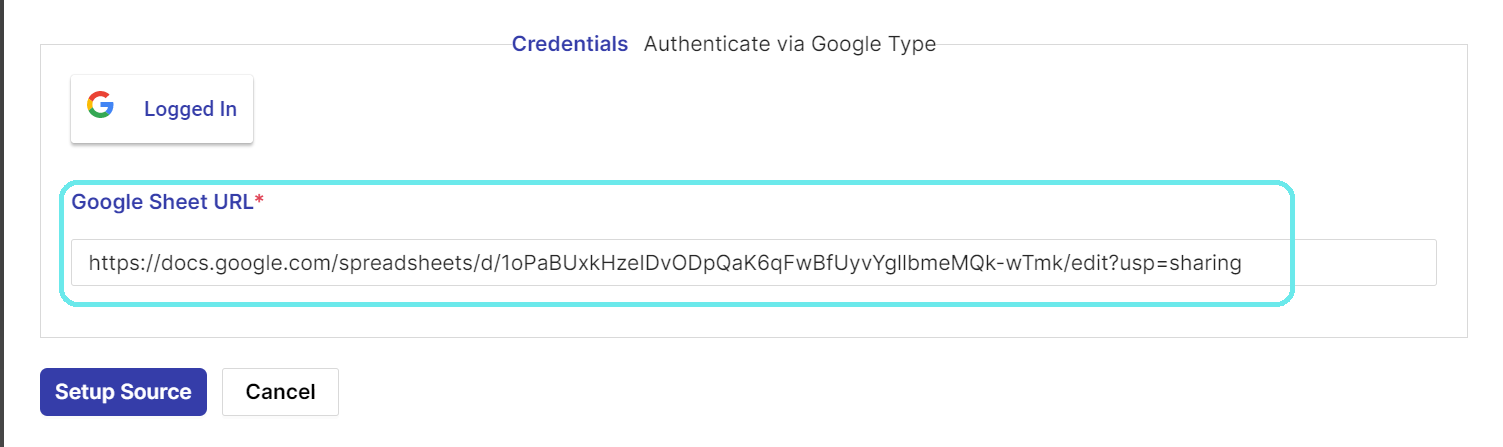
- Then click on Setup Source to save
You'll have to login every time you connect a new sheet.
If you get a "Refresh Token" message at this point, just repeat the Login step.
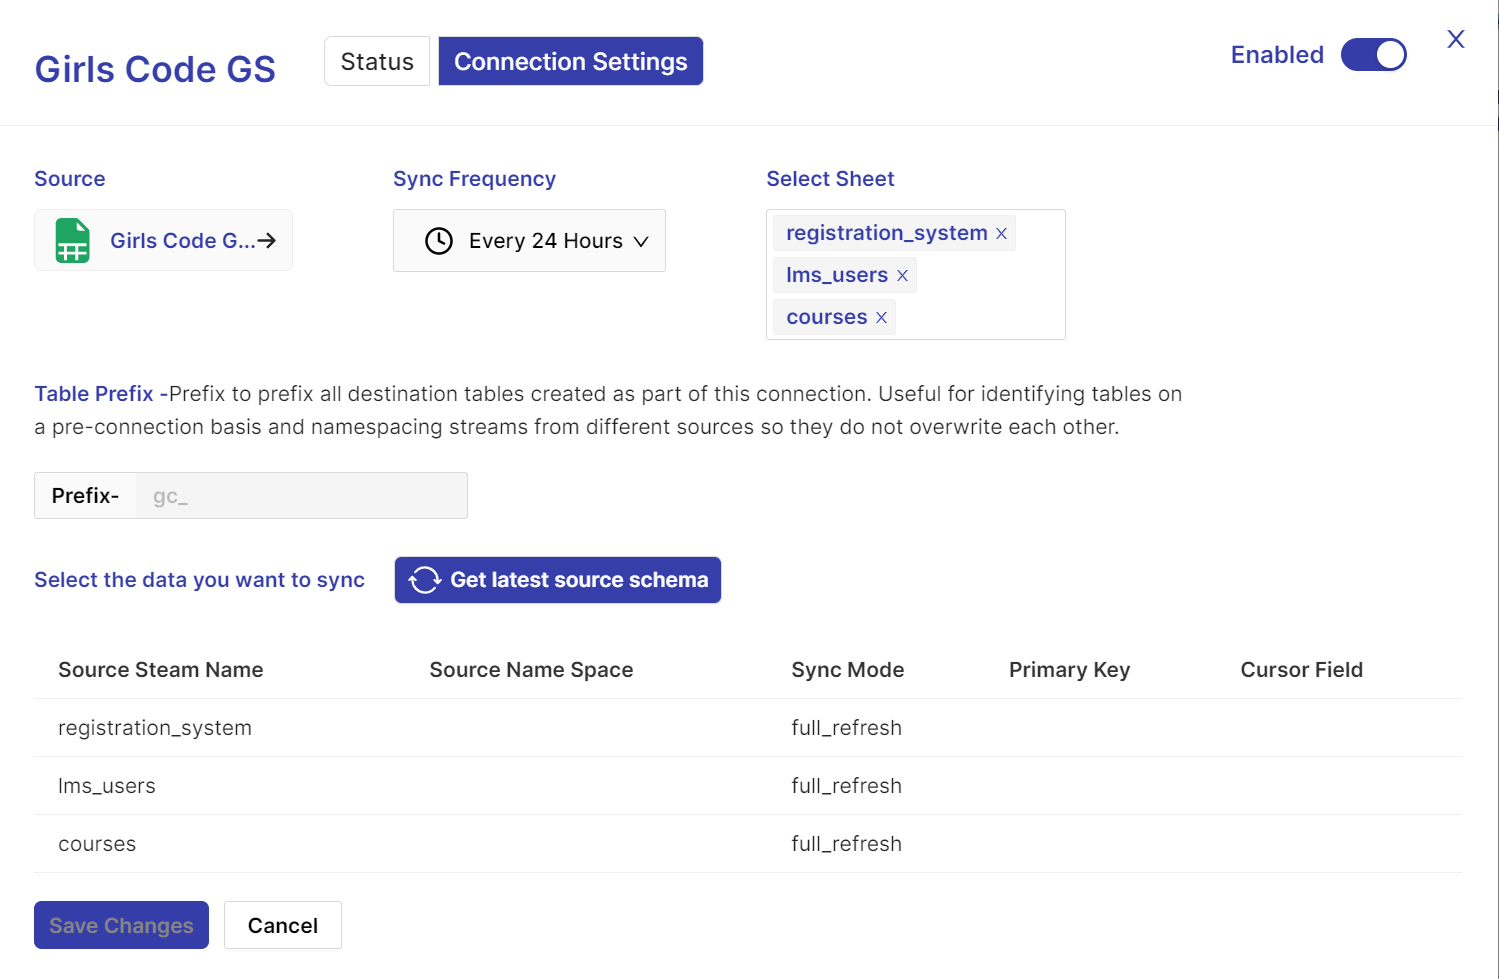
Step 5. Configure the connection
Now that the sheet has been connected, you'll configure:
(1) how often you want the data to be synced into Impact Cloud (to bring any new records that are added to your GS).
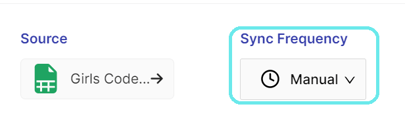
We recommend you choose "Manual" for GS that don't get changed that often (monthly, quarterly, yearly), since you can come back to Impact Cloud to refresh the data when you know changes have happened. When the data gets changed almost daily or weekly we recommend you choose "24 hours".
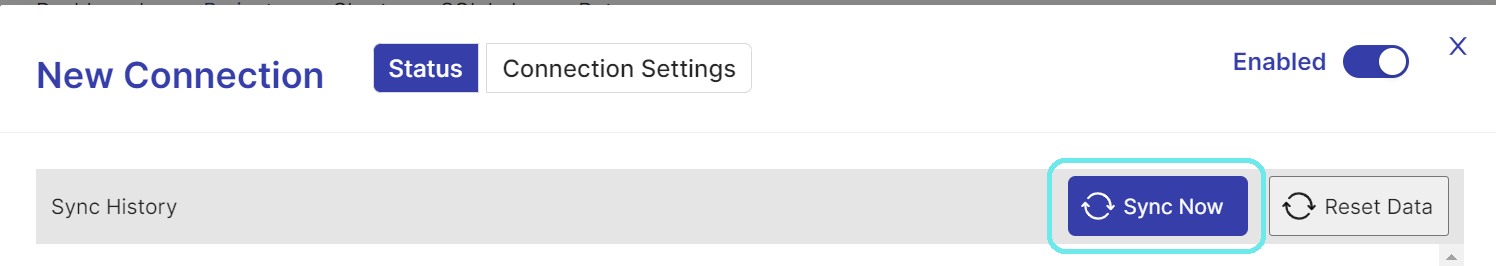
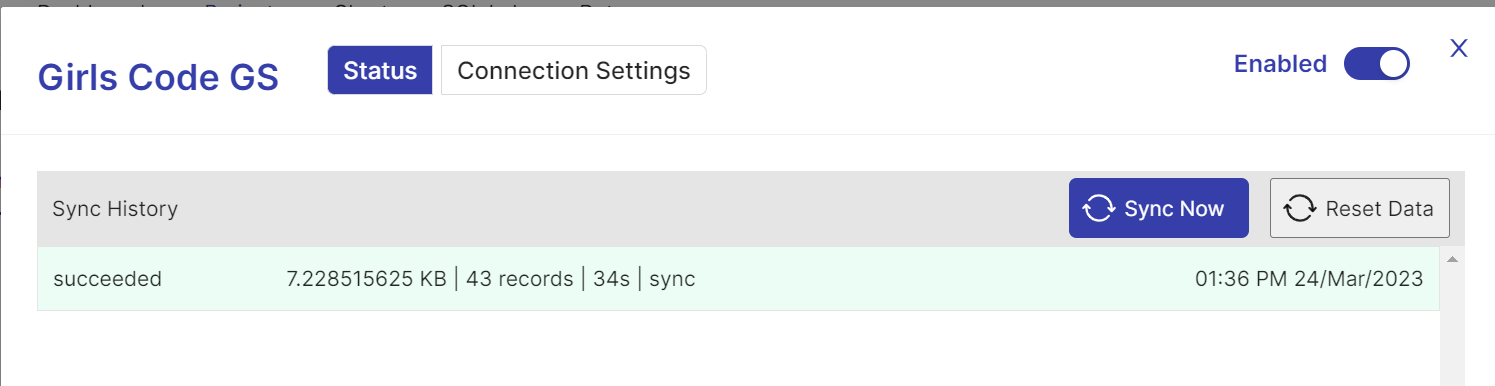
If you ever need an immediate sync you can still manually do that from the "Status" menu:
(2) which specific sheets you want to import
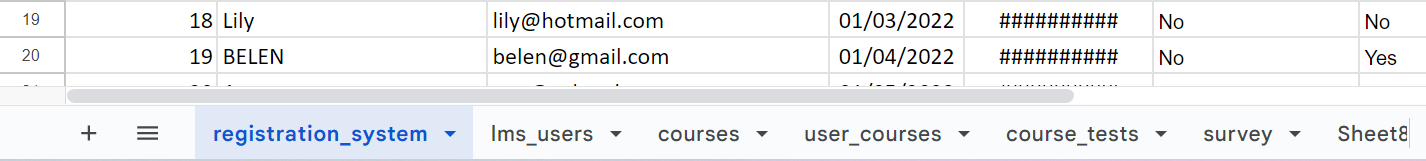
- Click on the "Select Sheet" field to display a dropdown of the existing sheets in the file
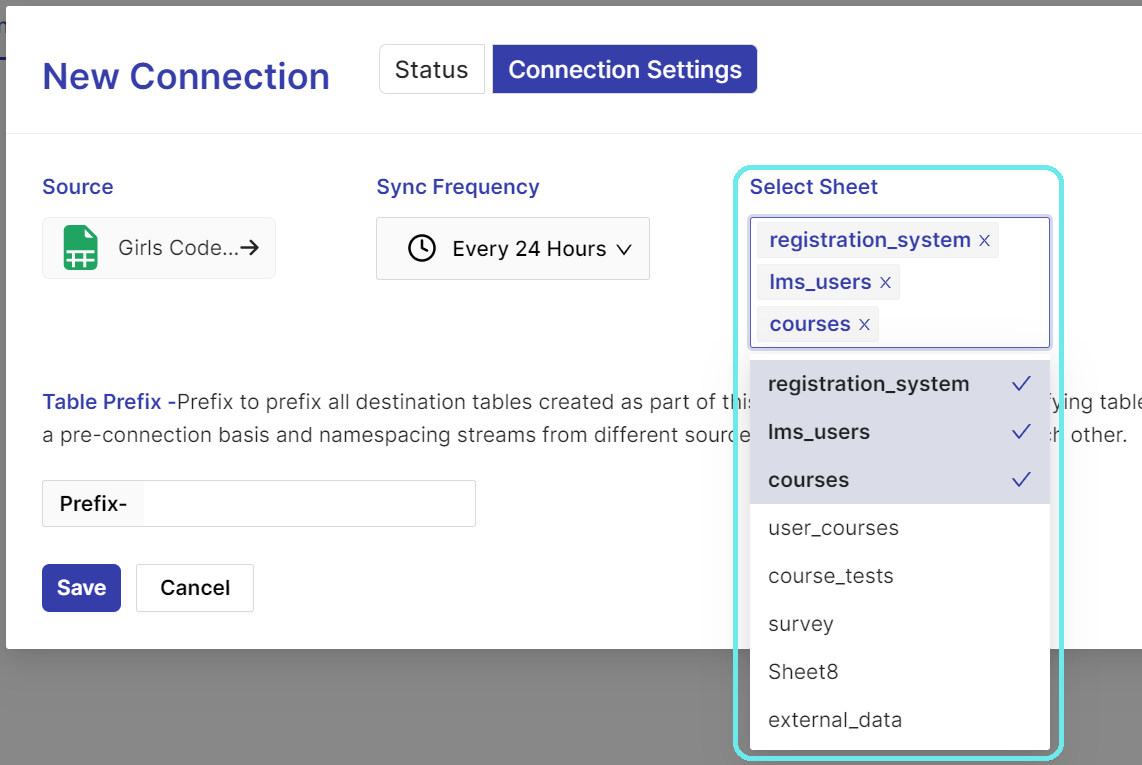
You'll notice they are the same as the tabs at the bottom of your GS
Note that the sheet names are how your datasets will be named once you import them into Impact Cloud, so make sure you're naming them in a way that you'll be able to identify them. Also, keep in mind not to use symbols or special characters here. Check out this articles for more tips on how to prepare a file before importing: Preparing data to import from Excel/CSV/Google Sheets
Only click on the ones that you want to use for impact measurement, you'll be able to add others later on if they are needed.
Step 6. Add a prefix to the tables' names
- Optional: Add a prefix to have a quick way of identifying all the sheets you're adding.
In this example, we're adding "gc_" as prefix to our sheets. 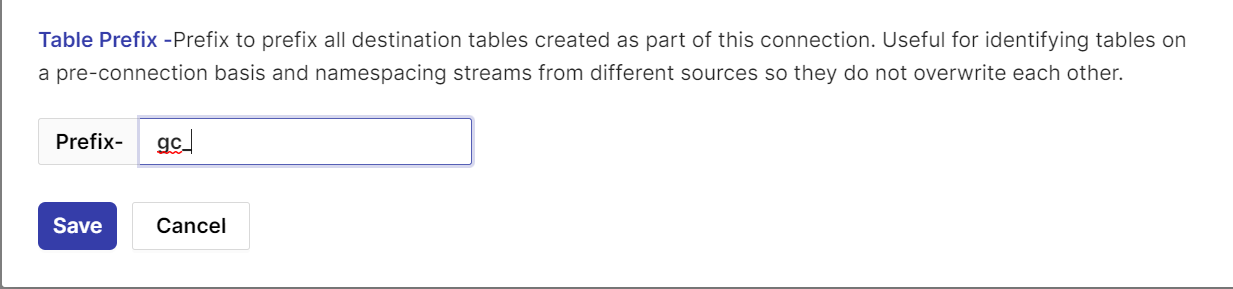
This means our sheets will be named: gc_registration_system, gc_lms_users, and gc_courses. This helps when other datasets in other projects are named similarly.
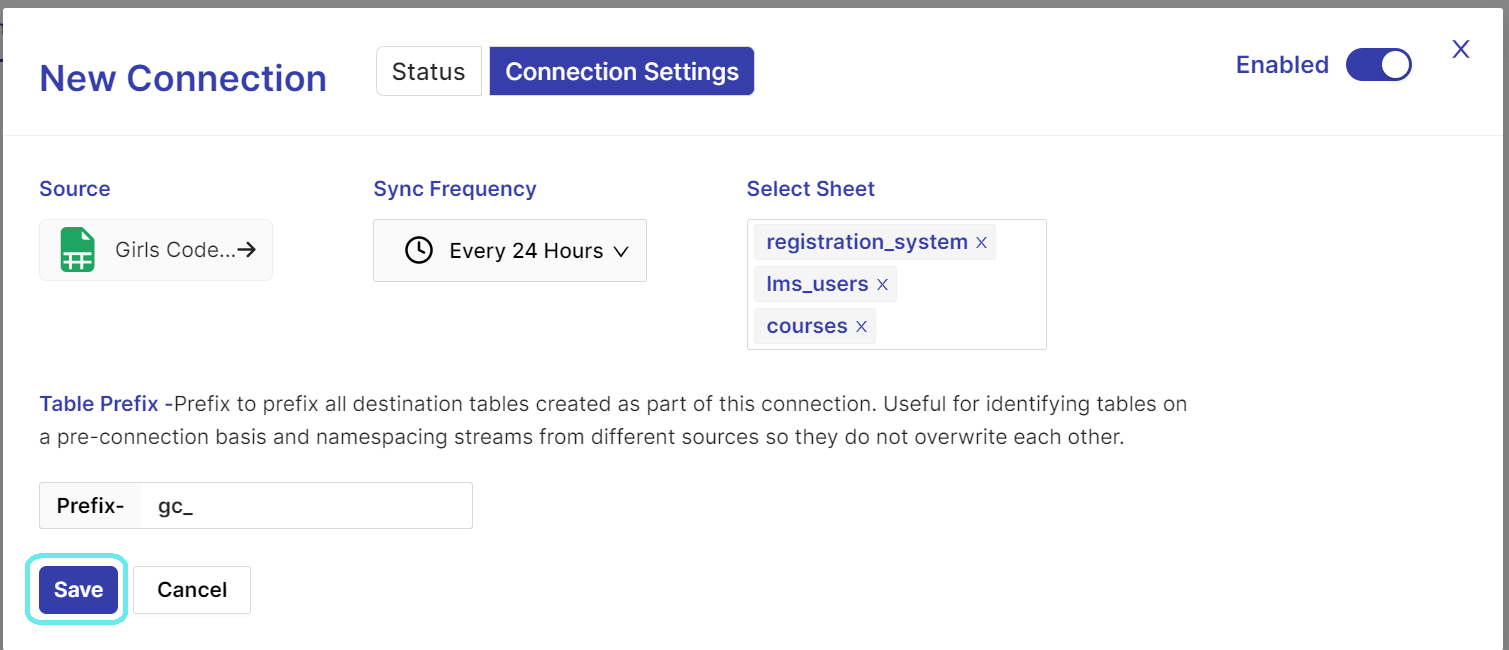
Step 7. Save your New connection
- Click on "Save" to import the GS with your selected configuration
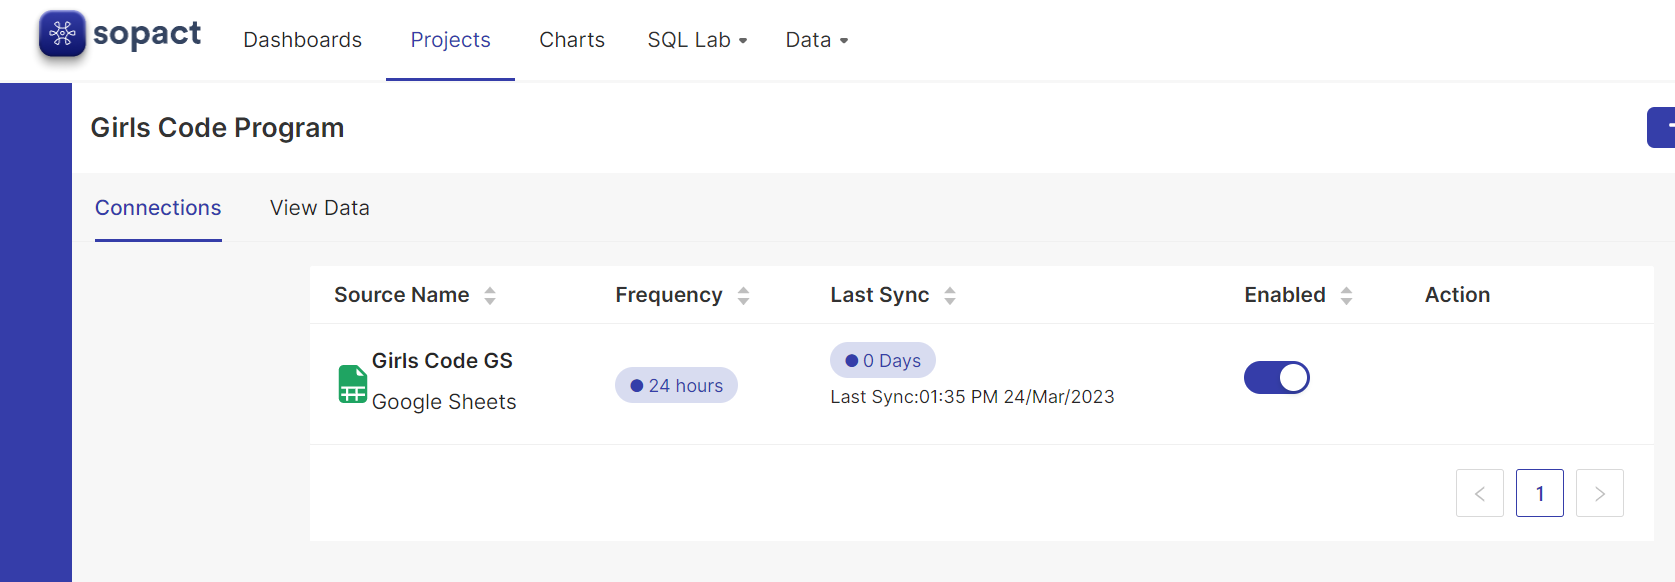
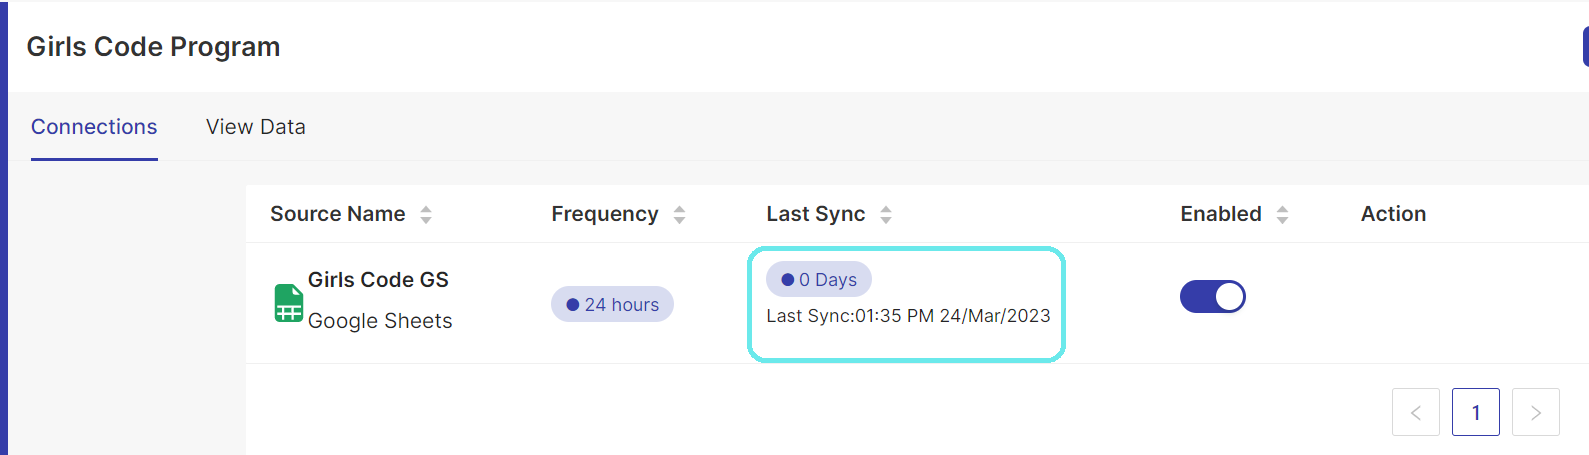
You'll see that it now show's up as an existing connection within the project:
- By clicking on it, you can see the set configuration
- You can go to "Status" to check the status of the connection. "Running" means it's being processed. "Succeded" means it's done. The first time the data is imported, it can take a few minutes to show that it has succeded:
You can also check the last sync information from the connection list:
Step 8. Start using your data for charts and dashboard
Now that the GS has been synced successfully, you can start using the data in each sheet to create charts.
- Go to Data>Datasets and you will see your datasets created
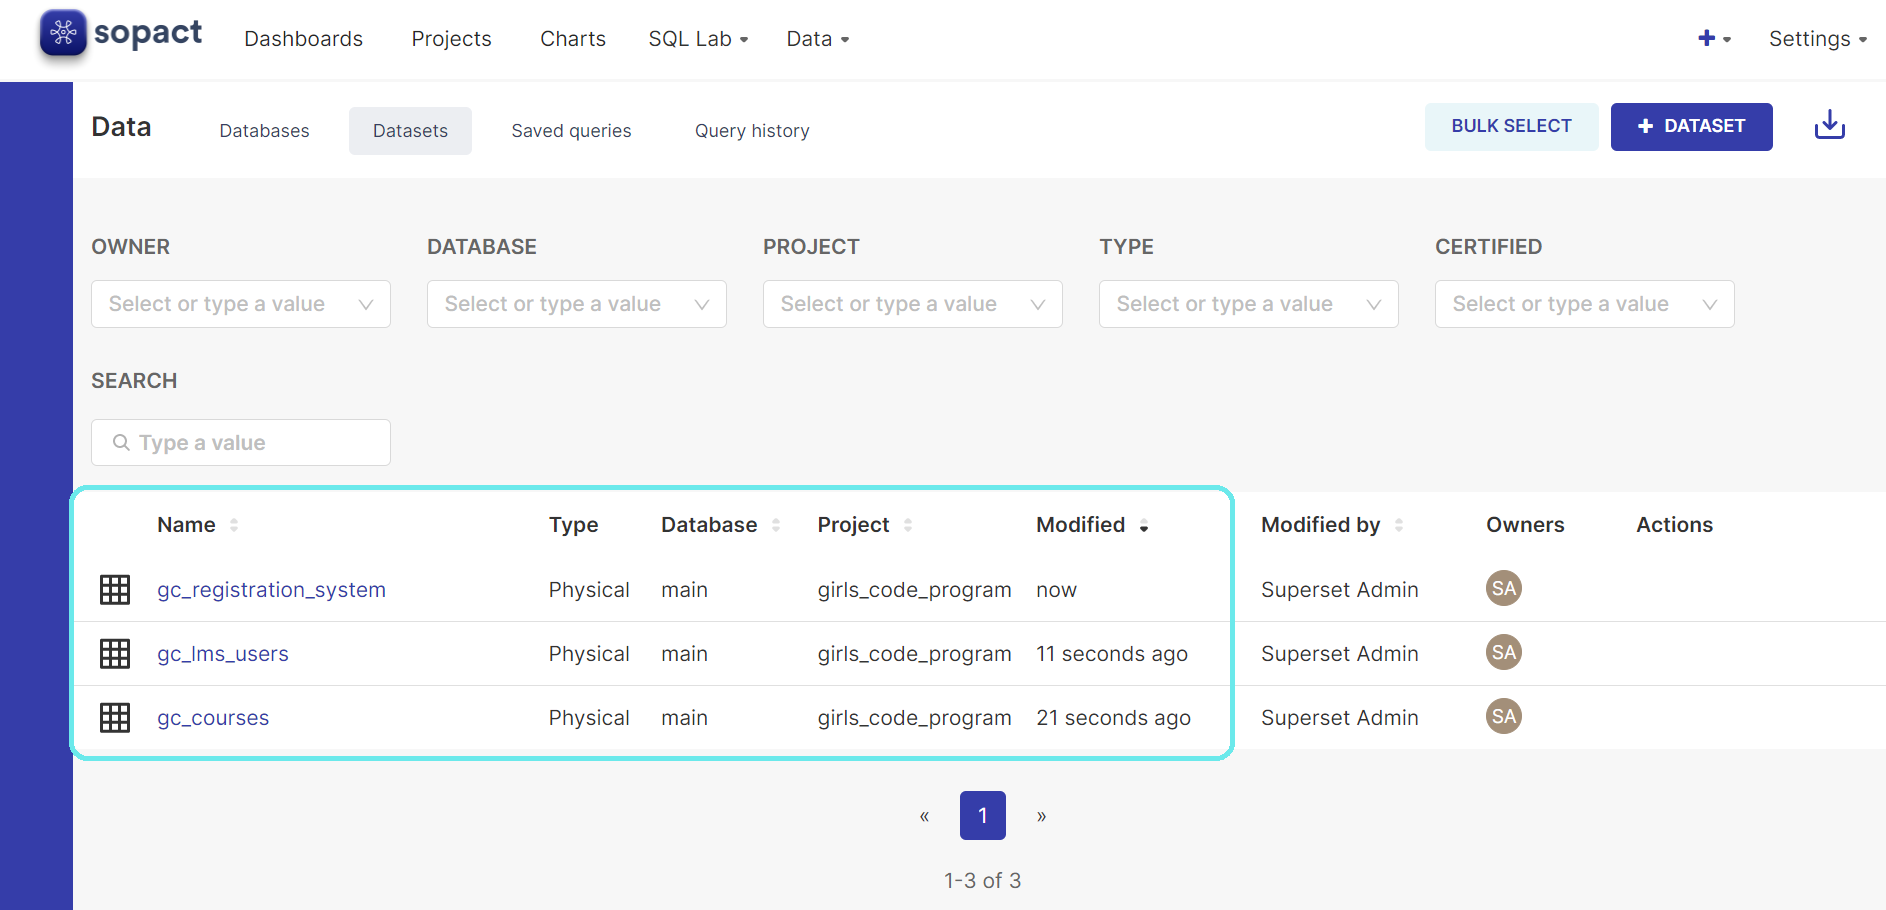
By clicking on each you'll be taken to the Chart creation for that dataset. Check out these articles for step-by-step tutorials on different types of Visualizations